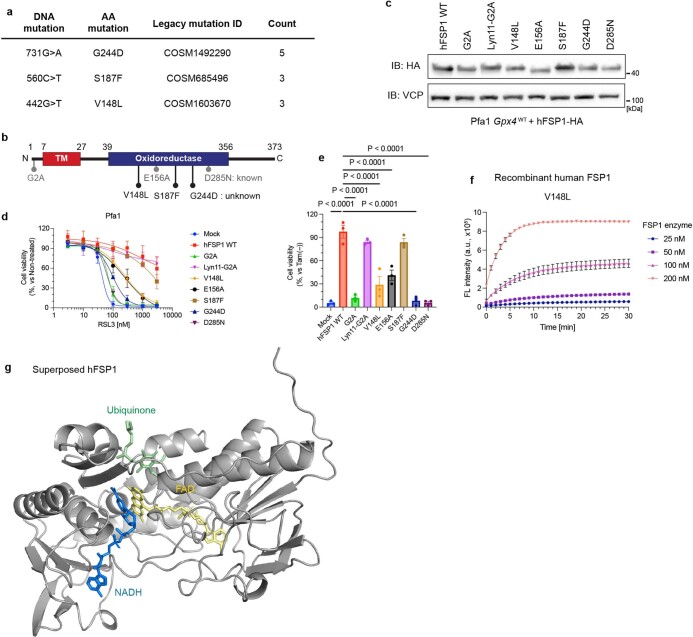
Extended Data Fig. 2. Analysis of somatic FSP1 mutations reported in cancer patients.
a. Somatic mutations of AIFM2 found in cancer patients using the COSMIC database. b. Schematic FSP1 enzyme representation with annotated functional mutations as reported. c. Immunoblot analysis of FSP1 and VCP expression in Pfa1 cells stably overexpressing wildtype hFSP1 or its mutant variants from a single experiment. d. Cell viability in Pfa1 cells stably overexpressing wildtype hFSP1 or its mutant variants treated with RSL3 for 24 h. e. Cell viability was measured after treating Pfa1 cells stably overexpressing wildtype hFSP1 or its mutant variants with or without 1 µM Tam for 72 h. Data was normalized by each group of non-treatment with Tam. Data represents the mean ± SEM of 3 wells of a 96-well plate from one out of 4 (d) or 3 (e) independent experiments. p values were calculated from one-way ANOVA followed by Dunnett’s multiple comparison test. f. Reduction of resazurin in the presence of FSP1 V148L at the indicated concentrations. Data represents the mean ± SD of 3 wells of a 96-well plate from one out of 3 independent experiments. g. Superimposed human FSP1 structure from AlphaFold2 database (https://alphafold.ebi.ac.uk). The cofactors, flavin adenine dinucleotide (FAD, yellow), nicotinamide adenine dinucleotide (NADH, blue) and ubiquinone (CoQ5, green) were embedded from the structure of the yeast orthologue, NDH-2 (Ndi1) (PDB: 4G73).

