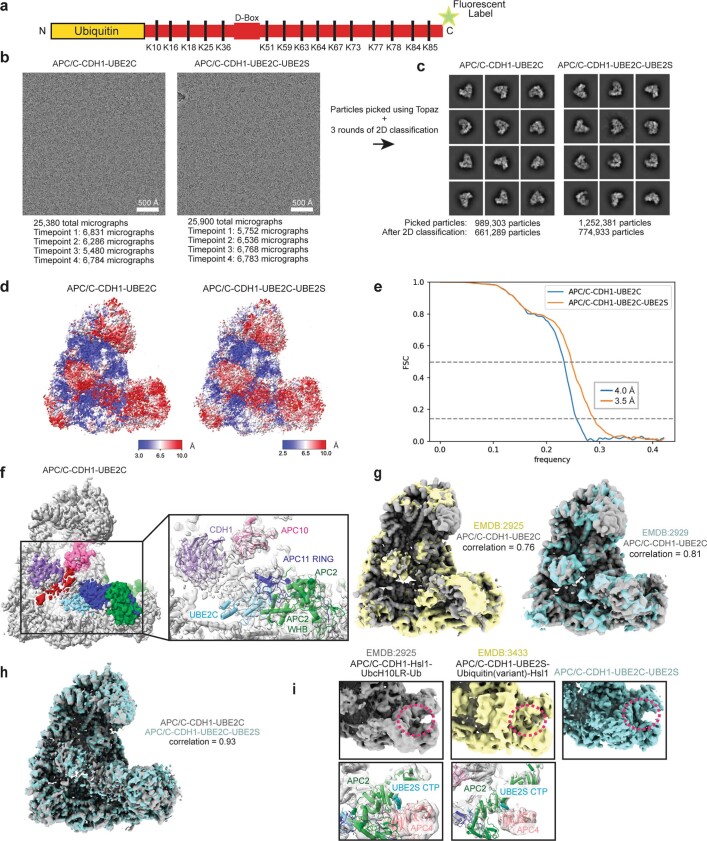
Extended Data Fig. 1. Processing and fitting of the APC/C from the TR-EM datasets.
a – Diagram depicting domain map of Ub-CycBN*. b, c – Cryo-EM data processing workflow showing representative micrographs from the APC/C-CDH1-UBE2C and APC/C-CDH1-UBE2C-UBE2S datasets (B). Particle detection was optimized using Topaz59 and filtered using 3 rounds of 2D classification. Representative 2D projections from the final 2D classification step show the APC/C in multiple orientations (C). d – Local resolution map of the consensus refinements from the datasets. e – FSC curves showing resolution of the 3D density maps from the consensus refinement from the APC/C-CDH1-UBE2C and APC/C-CDH1-UBE2C-UBE2S datasets. Lines show the 0.143 gold-standard and 0.5 cut-off with values denoting resolution at 0.143 cut-off. f – Similar to Fig. 1d, fitted model of APC/C-CDH1-UBE2C. g – Overlay of APC/C-CDH1-UBE2C electron density map from this study with published maps from previous studies. Values shown indicate map-to-map correlation of maps from previous studies (EMD-2925 and EMD-2929) with APC/C-CDH1-UBE2C from this data after gaussian filtering27,38. h – Overlay of electron density maps from the APC/C-CDH1-UBE2C and APC/C-CDH1-UBE2C-UBE2S consensus refinements, value shown indicates map-to-map correlation. i – Models showing UBE2S-CTP bound to the APC2/APC4 groove in previously described datasets (EMD-2925; EMD-3433)23,27 and here in the APC/C-CDH1-UBE2C-UBE2S dataset.

