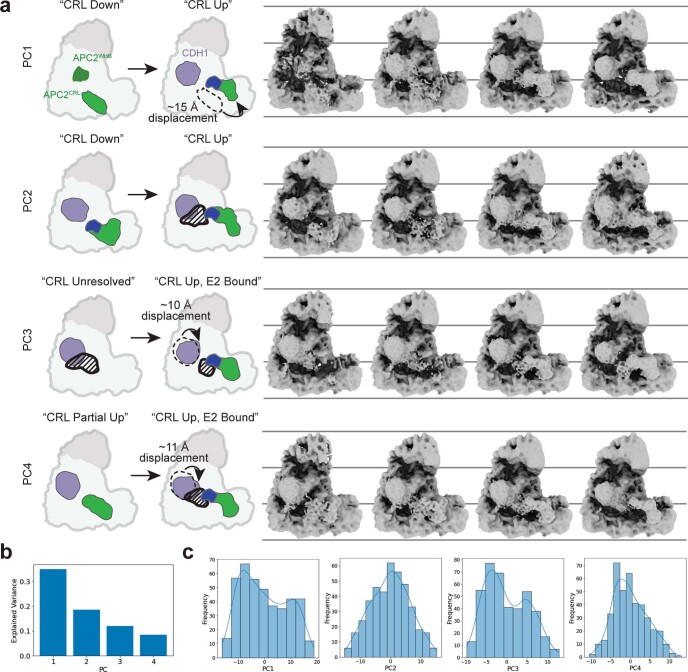
Extended Data Fig. 3. Movement of the APC/C during catalysis, shown in cryoDRGN volume PCA trajectories.
a – Volume PCA trajectories showing conformational changes along first four components to visualize displacement of CDH1 and the APC2 CRL along continuous conformational trajectories. Density changes localized near CDH1 and at the APC/C actives site shown in black stripes. b – Expected variance plotted for the first four components shown in A. c – Histograms showing distributions of volumes along the PCs shown in A.

