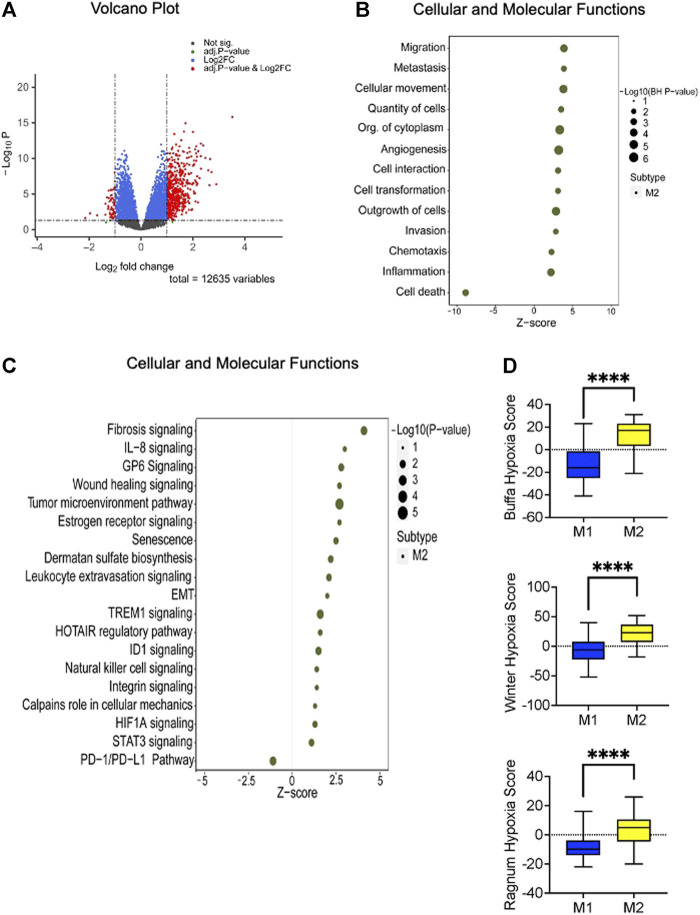
FIGURE 3.
Altered canonical pathways and functions linked to the high-risk (M2) subtype. (A) Volcano plot demonstrating the differentially expressed genes (n = 551) between the identified metabolic subtypes. Statistical significance is represented by BH adjusted p-value of 0.05 and a Log2 fold change threshold of ±1. (B) Ingenuity Pathway Analysis (IPA) of the differentially expressed genes reveals that the high-risk subtype is positively enriched in cellular proliferation, migration, and invasion. The enrichment analysis yields adjusted p-value less than or equal to 0.05. (C) Disrupted canonical pathways associated with M2 metabolic subtype encompass crucial signaling pathways. Fisher’s exact test results indicate a significance level of less than or equal to 0.05. The x-axis represents the activated z-score with sizes indicating the level of significance (right side of the plot). (D) The box plot illustrates the hypoxia scores associated with the identified metabolic subtypes. Based on previous studies (Winter et al., 2007; Buffa et al., 2010; Ragnum at el., 2014) patients with the M2 phenotype exhibits higher scores than M1 phenotype. The statistical significance of these comparisons was assessed using the Mann-Whitney U test, with a p-value threshold set at 0.05 or less.

