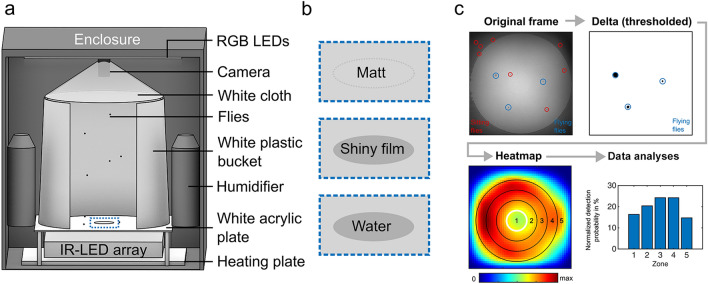
Fig. 1.
Data acquisition and processing. a Schematic of the flight arena setup with all main components (see material and methods). b Enlarged sections of the arena center in (a) summarizing the three bottom-plate stimuli (see material and methods). c Flow chart illustrating the procedure for detecting flying flies in recorded videos and analyzing the spatial distribution of flight detections. The heat map shows the spatial distribution of flight detections of an exemplary 1 h video recording

