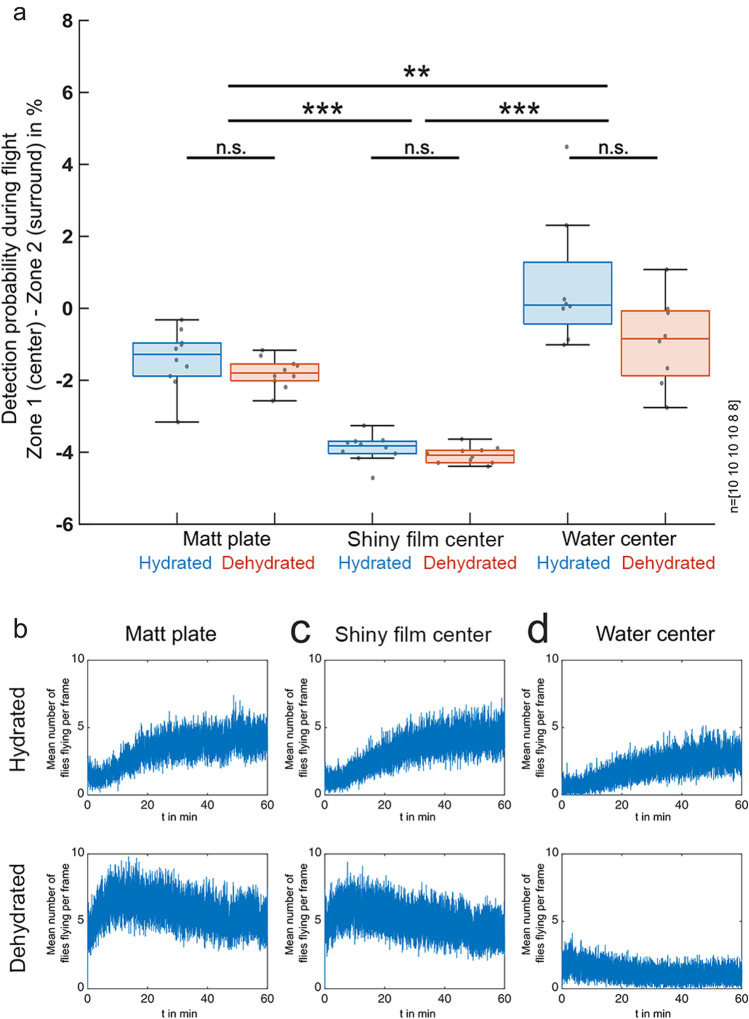
Fig. 4.
Statistics of hydrated vs. dehydrated flies and overall flight activity. a Statistical summary of detection probability during flight (zone 1–zone 2), directly comparing hydrated and dehydrated flies in all three experimental conditions. Number of 60-min recordings from left to right indicated at the right. *p < 0.05, **p < 0.01, ***p < 0.001. b–d Summary and direct comparison of flight activity (mean number of flies flying per frame) for hydrated flies (top) vs. dehydrated flies (bottom) in the arena after 60 min of recording of three experimental conditions: (b) completely matt surface; c matt plate with a shiny acetate film in the center; (d) matt plate with a water center

