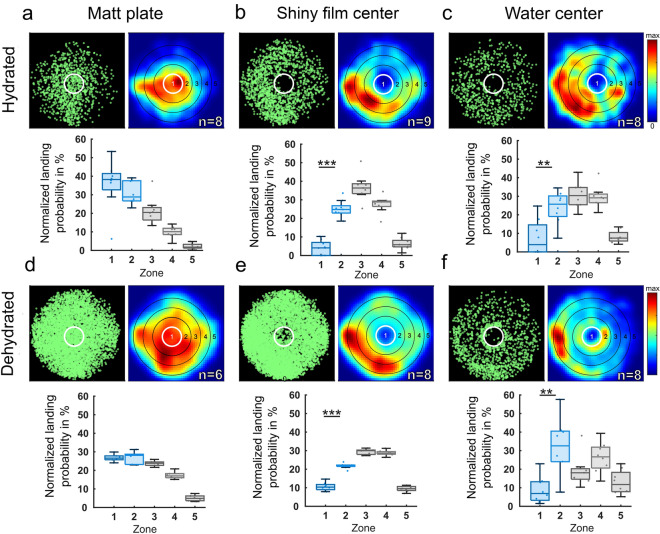
Fig. 5.
Quantification of landings of hydrated vs. dehydrated flies in response to three stimuli. a–c Summary and direct comparison of landing events of hydrated flies vs. d–f dehydrated flies in the arena after 30 min of recording of three experimental conditions: (a), (d) completely matt surface; (b), (e) matt plate with a shiny acetate film in the center; (c), (f) matt plate with a water center. For each condition, manually tracked landings are shown (green), as well as a normalized heat map of landing detections, and the normalized detection probability for landing Drosophila to be in each concentric zone. n indicates the number of 60-min recordings. *p < 0.05, **p < 0.01, ***p < 0.001

