Fig. 4.
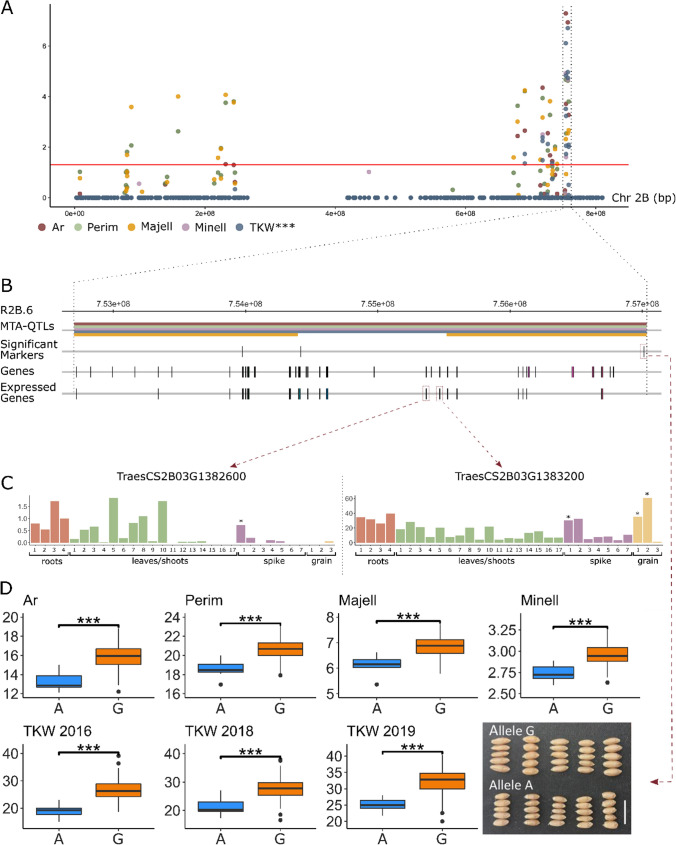
Details of the genomic region including the most significant MTA with TKW (R2B.6). A Manhattan plot for chromosome 2B, including MTAs for Area (Ar), Perimeter (Perim), Major Ellipse (Majell), Minor Ellipse (Minell) and Thousand Kernel Weight (TKW; number of * indicate the number of years for which associations were found). P-values in this figure where corrected by Bonferroni (that is, multiplied by the number of independent tests performed). B Zoom of R2B.6. C Putative candidates and their expression values. * indicates expression > 0.5 TPM (For roots 1:radicle, 2: roots, 3: root apical meristem, 4: axillary roots; for leaves/shoots 1:coleoptile, 2: stem axis, 3: first leaf sheath, 4: first leaf blade, 5: shoot apical meristem, 6: third leaf blade, 7: third leaf sheath, 8: fifth leaf sheath, 9: fifth leaf blade, 10: shoot axis, 11: flag leaf blade, 12: leaf ligule, 13: flag leaf sheath, 14: Internode #2, 15: peduncle, 16: fifth leaf blade senescence, 17: flag leaf blade senescence; for spike 1: spike, 2: spikelets, 3: awns, 4: glumes, 5: lemma, 6: anther, 7: stigma & ovary; for grain 1: grain, 2: endosperm, 3: embryo proper, according to www.wheat-expression.com; Ramírez-González et al. 2018; Borrill et al. 2016)). D Average trait value according to the allele carried by the accessions in the most significant MTA. The picture illustrates the differences on grain size between ten landraces, five carrying allele A (BGE001942, BGE018217, BGE023723, BGE001983, BGE002012) and five allele G (BGE001945, BGE015402, BGE023725, BGE003236, BGE003156)

