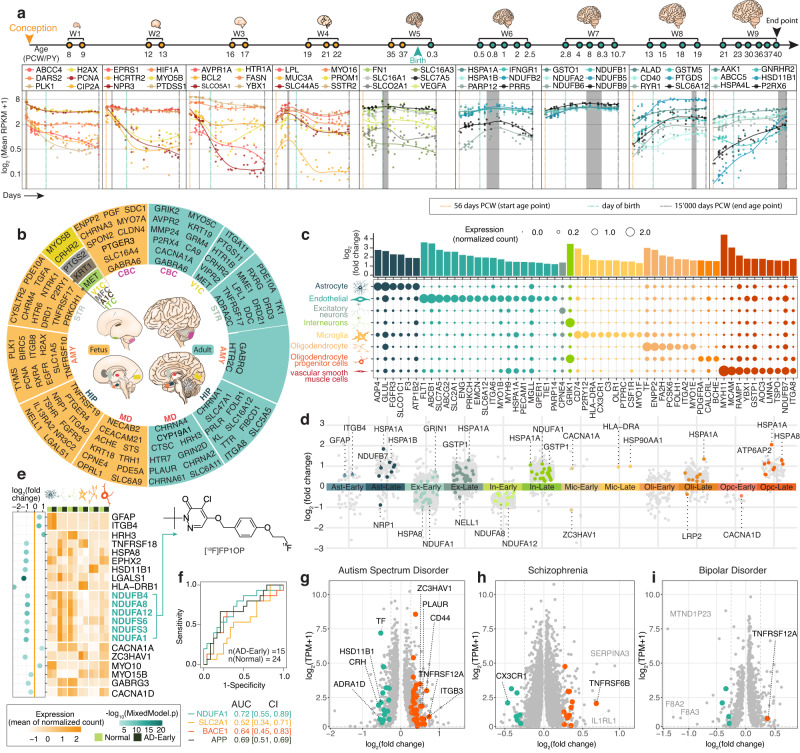
Fig. 3. The Imageable Genome in neurology.
a Representative temporally imageable genes across 9 brain development windows (W1–9). Dots represent the expression level calculated from all brain regions of a sample within a window. PCW: postconceptional weeks. PY postnatal years. Grey box: corresponding development window. b A donut chart showing the prenatal (left, yellow) and adult (right, lake blue) brain regional imageable genes. CBC, cerebellar cortex; V1C, primary visual (V1) cortex; STR, striatum; AMY, amygdala; HIP, hippocampus; MD, mediodorsal nucleus of thalamus; MFC, medial prefrontal cortex; A1C, primary auditory (A1) cortex; ITC, inferior temporal cortex. c Dot plot depicting the expression of cell type specific imageable genes in eight adult brain cell types, with colour code corresponding to cell type. d A scatter plot of Early or Late-Alzheimer’s disease related imageable genes across 6 cell types. The top ranked imageable genes are highlighted with colour code corresponding to cell type. Ast astrocytes, Ex excitatory neurons, In inhibitory neurons, Mic microglia, Oli oligodendrocytes, Opc oligodendrocyte precursor cells. e Top ranked Early-Alzheimer’s disease (AD-Early) related imageable genes sorted by absolute log2 (mean gene expression in AD-Early/mean gene expression in Normal) (shown as: log2(fold change)) values across 6 cell types. Z-score normalized read counts are shown (two sided Wilcoxon-rank sum test at FDR < 0.01, absolute log2(fold change) >0.25, and Poisson mixed model at FDR < 0.05). NADH:ubiquinone oxidoreductase supernumerary subunits were labelled in lake blue, followed by a chemical structure of Fluorine-18 radioisotope labelled PET radiotracer targeting the mitochondrial complex. Cell-type icons created with BioRender.com. f Area under the receiver operating curve (AUC) values representing the capacity of imageable genes and 3 reference genes in discriminating Early-Alzheimer’s disease and healthy brains. g–i Volcano plots of genes differentially expressed in g autism (ASD, n = 43), h schizophrenia (SCZ, n = 558), and i bipolar disorder (BD, n = 216) versus healthy brains (n = 986). Up-regulated (red) or down-regulated (green) imageable genes are highlighted. Ast astrocytes, Endo endothelial cells, Ex excitatory neurons, In inhibitory neurons, Mic microglia, Oli oligodendrocytes Opc oligodendrocyte precursor cells, Vsmc vascular smooth muscle cells. Source data are provided as a Source data file. Cell type icons are created with BioRender.com.

