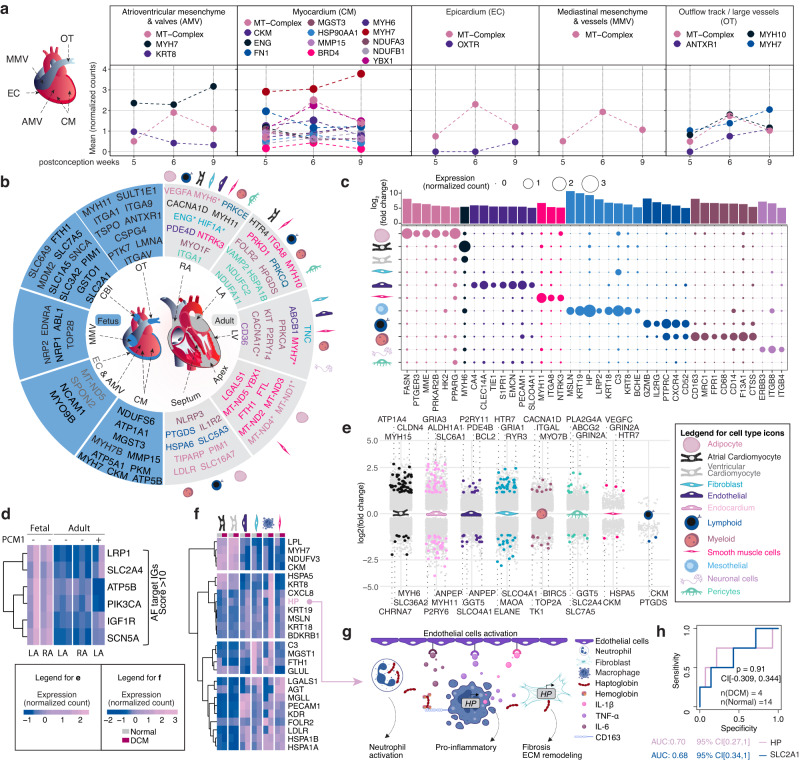
Fig. 4. The Imageable Genome in cardiology.
a Temporally imageable genes during human embryonic heart development within each region. A scheme showing the structure of the human embryonic heart at 5–9 post-conception weeks (Created with BioRender.com). Genes coding for mitochondria complex I-IV subunits are grouped and named into MT-complex. b Regional imageable genes for human embryonic heart (left, blue) and adult heart of each cell type (right, grey). CM cardiomyocyte, LV left ventricular, LA left atrial, RA right atrial, OT outflow track, CBI cavities with blood and immune cells, AMV atrioventricular mesenchyme and valves, MMV mediastinal mesenchyme and vessels, EC epicardium. c Dot plot depicting the expression of cell-type-specific imageable genes in eleven adult heart cell types, with colour code corresponding to cell type and circle size representing the relative gene expression level. d Heatmap of atrial fibrillation (AF) target imageable genes up- or down-regulated in adult PCM1 labelled (Pericentriolar Material 1 antibody) left atrial cells versus adult whole atrial tissue expression, or up-regulated in the fetal atrium versus the adult atrium. e Expression of adult dilated cardiomyopathy (DCM) related genes in each cell type (DCM = 18, n (healthy) = 27). The top ranked imageable genes are highlighted in colour corresponding to cell type. f Heatmap of top ranked DCM related imageable genes in 6 cell types. Haptoglobin (HP) was labelled in pink. g Schematic illustrating the HP cellular function and potential pro-inflammatory effects under heart failure condition (Created with BioRender.com). h AUC values (95% confidence interval (CI)) representing the capacity of HP and GLUT1 (SLC2A1) expressions in discriminating DCM and healthy states of the adult human hearts including 4 cell types: EC (endocardium), FB (fibroblasts), MP (macrophages) and SMC (smooth muscle cells). p value with 95% CI calculated from two-sided DeLong’s test for two ROC curves. Source data are provided as a Source data file. Cell-type icons are created with BioRender.com.

