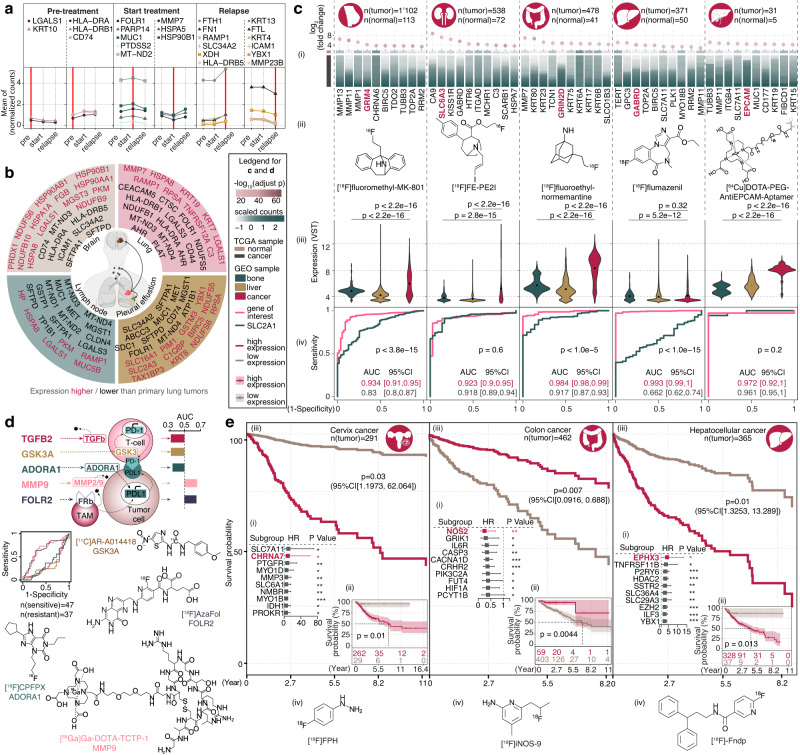
Fig. 5. The Imageable Genome in Oncology.
a Expression of top ranked disease status related imageable genes in malignant ovarian epithelial cells over time: at diagnosis (pre-treatment), under therapy (treatment), and in relapse as indicated by an augmented serum CA-125 level (two-sided Wilcox test). b Tissue origins during lung cancer metastasis and top ranked imageable genes differentially expressed at advanced or metastatic sites versus primary site, two-sided Student’s t test p < 0.01 with Bonferroni correction<0.01, |log2(fold change)|>0.585. c Top diagnostic imageable genes across 5 cancer types. log2(fold change)>0.5 and Limma moderated t-statistic with Bonferroni correction<0.01. (i) heatmap illustrating the gene expressions (columns) in normal or cancer tissue (rows); (ii) an gene of interest (GOI) in mauve with a chemical structure of PET radiotracer targeting the GOI; (iii) violin plot of GOI expression in bone (n = 284), liver (n = 1759) and mammary cancer (n = 5541), kidney cancer (n = 349) or intestines cancer (n = 2227), two-sided Wilcoxon test p values are shown. (iv) ROC curves of GOI and SLC2A1 with 95% confidence interval (CI) and two-sided DeLong’s test p value for two correlated ROC curves. d A schematic showing the predictive capacity (ROC curves, sensitive: PD1-blockage treatment responder, resistant: non-responders) of 5 representative imageable genes, and their clinical radiotracers. e Prognostic imageable genes in, left to right, Cervix cancer, Colon cancer and Hepatocellular cancer. For each cancer, (i) top ranked imageable genes sorted by p values from Wald test by fitting Cox proportional hazards (CPH) models to evaluate the effect of covariates on overall survival, with the best cutoff determined (see “Methods”). A square represents the Hazard Ratio (HR) with a horizontal line extending on either side representing the 95% CI. GOI is labelled in mauve. *p < 0.05; **p < 0.01; ***p < 0.001; (ii) Kaplan–Meier overall survival with Log-Rank test p value; (iii) cox regression overall survival curves distinguishing GOI high/low expression groups (multivariable survival analyses with Wald test p values by fitting CPH model); (iv) chemical structure of PET radiotracer targeting the GOI. Cancer-type icons are created with BioRender.com. Source data are provided as a Source data file.

