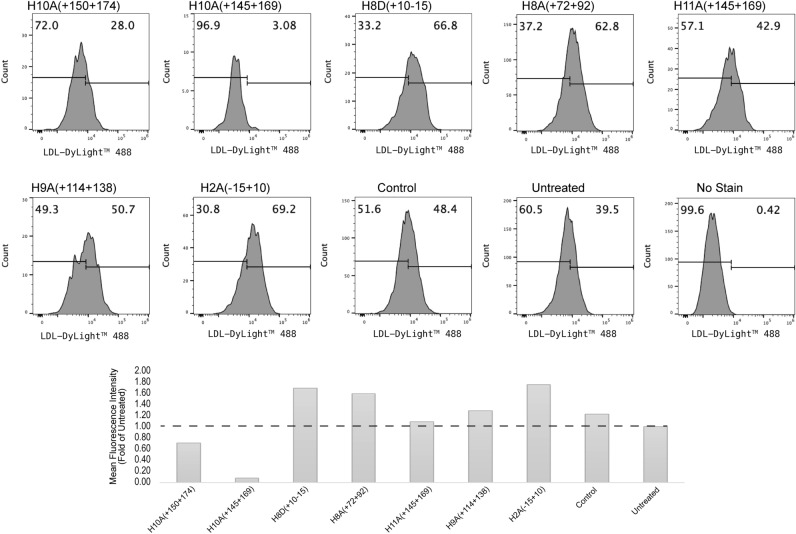
Figure 4.
Flow cytometric analysis of low-density lipoprotein (LDL) uptake in Huh-7 cells after 10 µM PMO treatment for 4 days. Fluorescence frequency distribution plot of samples (top) and the mean fluorescence intensity fold change compared to untreated (bottom). Control; sample treated with Dmd M23D(+ 07 − 18) PMO. The PMO identities are shown above the histograms and below the bars. The no stain sample indicates cells not treated with LDL uptake assay.

