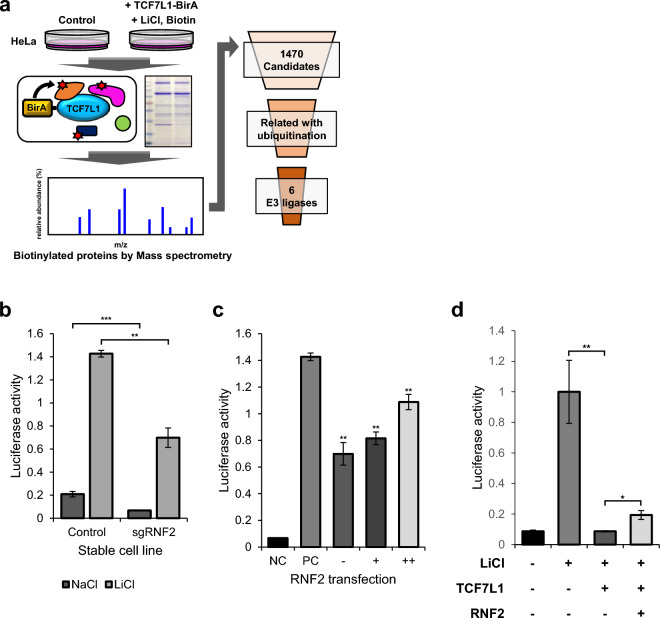
Figure 2.
Candidate gene screening through mass spectrometry and luciferase assay. (a) Schematic diagram depicting the process of screening candidate genes that interact with TCF7L1. (b) TOPflash luciferase assay was performed using control HeLa cells and stable RNF2 knockdown cell lines. Cells were transfected with the indicated plasmids (50 ng TK-Renilla reporter; 200 ng TOPflash) and then treated with 50 mM NaCl and LiCl conditioned media for 16 h. N = 3 independent experiments. (c) TOPflash luciferase assay was performed using RNF2 knockdown stable HeLa cells. Cells were transfected with the indicated plasmids (50 ng TK-Renilla reporter; 200 ng TOPflash; 1 μg; 2 μg pCS2 + RNF2) and then treated with 50 mM NaCl and LiCl conditioned media for 16 h. The negative control (Co) was treated with 50 mM NaCl conditioned media. The positive control (PC) is performed using control HeLa cells with 50 mM LiCl conditioned media. N = 3 independent experiments. (d) TOPflash luciferase assay was performed using control HeLa cells. Cells were transfected with the indicated plasmids (50 ng TK-Renilla reporter; 200 ng TOPflash; 0.5 μg pCS2 + TCF7L1; 2.5 μg pCS2 + RNF2) and then treated with 50 mM LiCl conditioned media for 16 h. N = 3 independent experiments.

