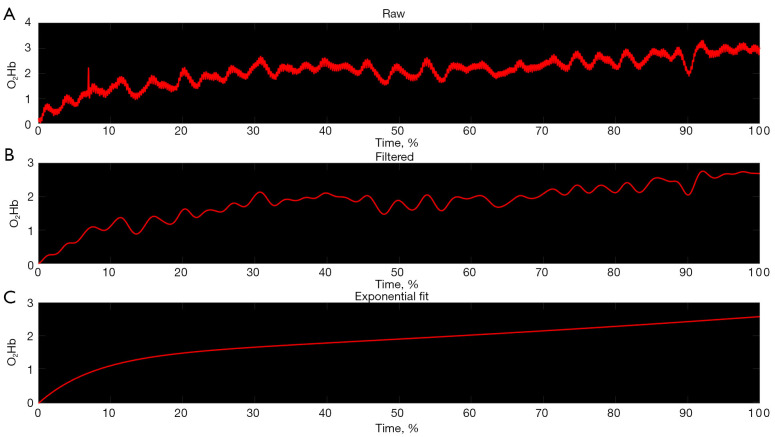
Figure 2.
fNIRS signal filtering. (A) Raw fNIRS signal O2Hb optical density imported from the manufacturer software (OxySoft, Artinis Medical Systems) into MATLAB (MathWorks). (B) Filtered data after applying a low pass filter (Gaussian, 1 s) to eliminate heart rate. (C) Mono-exponential curve fit for the filtered data. fNIRS, functional near infrared spectroscopy; O2Hb, oxyhemoglobin.

