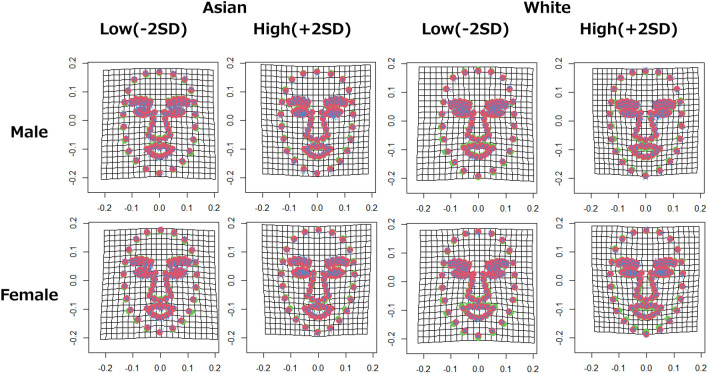
Figure 1.
Visualization results of landmark points by geometric morphometrics. The left side is Asian, and the right side is white. The upper row shows the change from the average shape of landmark points corresponding to the attractiveness ratings of male face images. The lower row shows the change from the average shape of landmark points corresponding to the attractiveness ratings of female face images. Red dots indicate landmark points with the average shape, and green dots indicate landmark points with the shape after deformation. The blue arrows indicate the direction of the variation: Low (−2 SD) indicates the result when the attractiveness ratings is manipulated toward −2 SD, and High (+2 SD) indicates the result when the attractiveness ratings is manipulated toward +2 SD.

