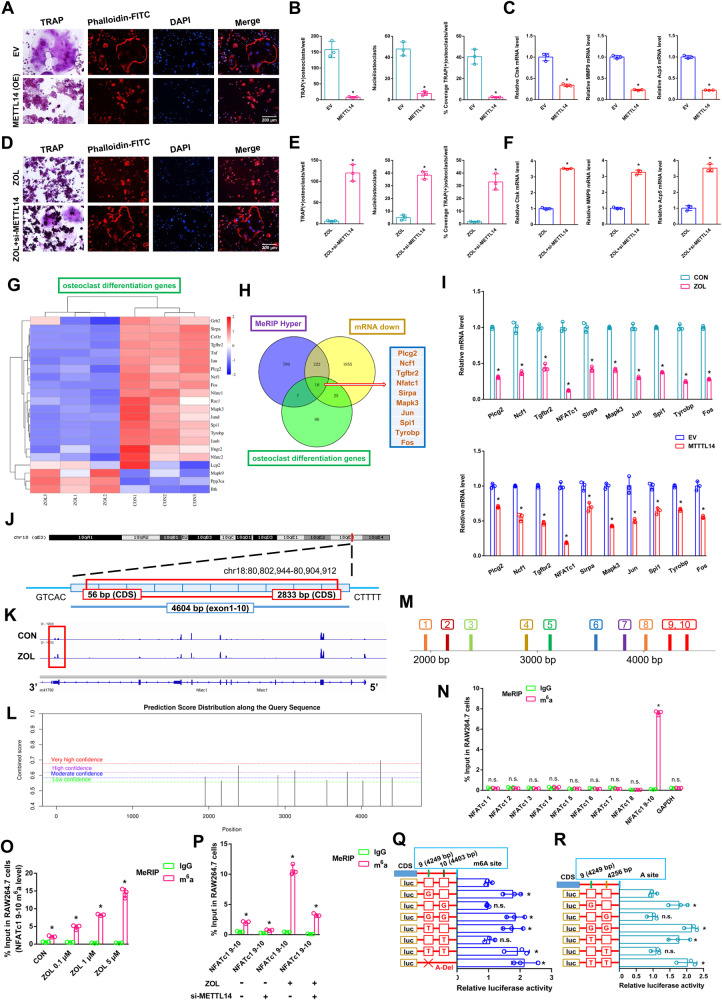
Fig. 3. The effects of the NFATc1–9 segment on the process by which METT14 regulates osteoclast differentiation.
First, METTL14 was transfected into RAW264.7 cells and prepared for further study. A TRAP staining and F-actin band staining were applied to detect osteoclast differentiation between the two groups. Scale bar: 200 μm. B Histograms of the number, coverage rate and nuclei of TRAP-positive osteoclasts between the two groups. C Relative expression levels of Ctsk, MMP9 and Acp5 in RAW264.7 cells between the two groups. After ZOL stimulation, si-METTL14 was transfected into RAW264.7 cells and prepared for further study. D TRAP staining and F-actin band staining were applied to detect osteoclast differentiation between the two groups. Scale bar: 200 μm. E Histograms of the number, coverage rate and nuclei of TRAP-positive osteoclasts between the two groups. F Relative expression levels of Ctsk, MMP9 and Acp5 in RAW264.7 cells between the two groups. G Heatmap showing the differentially expressed genes of osteoclast differentiation after ZOL stimulation. H KEGG analysis revealing the differentially expressed genes from three intersections: osteoclast differentiation genes, MeRIP hyper genes and mRNA down genes. I RT-qPCR analysis revealing the expression levels of 10 differentially expressed genes after ZOL stimulation or METTL14 overexpression. J Schematic diagram showing the genomic location of NFATc1. K m6A peak visualisation of meRIP-Seq in NFATc1 transcripts with or without ZOL stimulation. The m6A peaks are in the 3’UTRs of NFATc1. L The potential m6A methylation loci of NFATc1 on the SRAMP website. M We divided 9 segments of NFATc1 according to the potential m6A methylation loci. N m6A-RT-qPCR assay was performed to detect the enrichment of 9 segments of NFATc1 between the anti-m6A group and anti-IgG group after ZOL stimulation. O An m6A-RT-qPCR assay was performed to detect the enrichment of the NFATc1–9, 10 segment as the ZOL concentration increased. P An m6A-RT-qPCR assay was performed to detect the enrichment of the NFATc1–9, 10 segment under ZOL or si-METTL14 stimulation. Q, R Two m6A modification sites were validated through step-by-step mutation of luciferase reporters. Data are representative of three independent experiments expressed as the mean ± SD (*p < 0.05).

