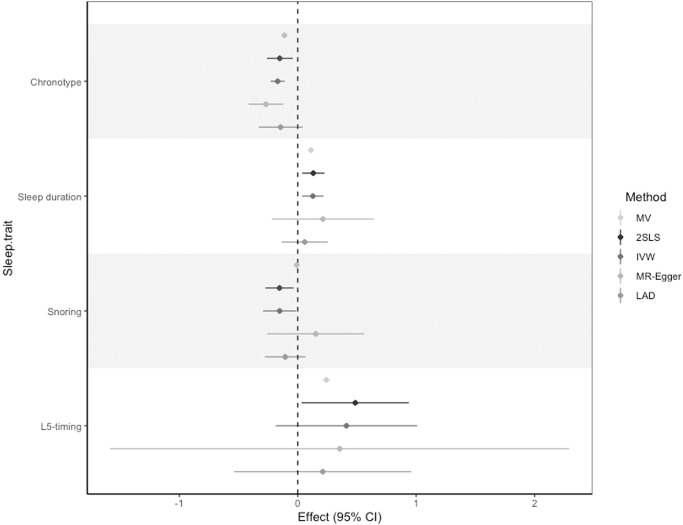
Fig. 4. Comparison of multivariable and Mendelian randomisation estimates in UK Biobank.
MV multivariable regression, 2SLS two-stage least squares, IVW inverse-variance weighted, MR-Egger MR-Egger approach, LAD least absolute deviation. Estimates represent the mean difference in the spouse’s sleep trait (in SD) per SD increase in an individual’s own sleep trait, with the exception of snoring for which estimates represent risk difference. 95% confidence intervals are shown. Sample sizes are given in the accompanying source data (Supplementary Data 15).

