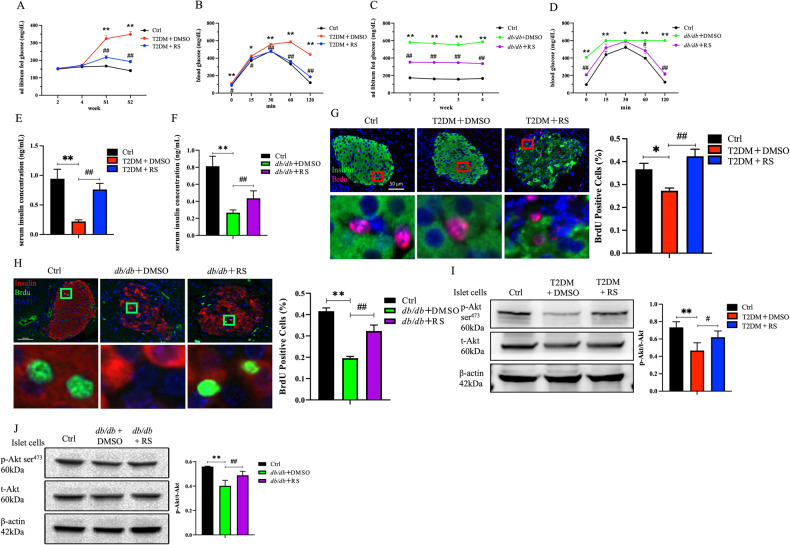
Fig. 5. Blockade of MCP-1/Akt pathway improved glucose metabolism disorders and the p-Akt level in diabetic mice.
A The ad libitum fed glucose levels of the T2DM + DMSO group were significantly elevated in S1 and S2 after STZ intervention compared to the Ctrl group. However, the ad libitum fed glucose levels in the T2DM + RS group showed a marked decrease at S1 and S2 compared to the T2DM + DMSO group. B The blood glucose levels at each time point during IPGTT in the T2DM + DMSO group were clearly higher than those in the Ctrl mice, however, the blood glucose levels in the T2DM + RS group were obviously declined compared to the T2DM + DMSO group. C Ad libitum fed glucose levels were dramatically elevated in db/db + DMSO mice compared to the Ctrl group, while they were signally reduced in db/db + RS mice compared to the db/db + DMSO group. D The changes in blood glucose at each time point during IPGTT after different treatments in db/db mice were consistent with those in the T2DM mice (n = 6). E, F The serum insulin levels in the T2DM + DMSO/db/db + DMSO groups were distinctly reduced compared to the Ctrl group, while the serum insulin levels in the T2DM + RS/db/db + RS group were increased compared to the T2DM + DMSO/db/db + DMSO group (n = 10 and 8). G, H Compared to the Ctrl mice, the proliferation of islet cells in the T2DM + DMSO/db/db + DMSO mice was markedly reduced, and the administration of the MCP-1 receptor antagonist to block the MCP-1 signaling in vivo overtly increased the proliferation of islet cells in the T2DM + RS/db/db + RS mice (n = 5). I, J Compared to the Ctrl group, the level of p-Akt in the pancreatic islet cells of the T2DM + DMSO/db/db + DMSO group was significantly downregulated. However, the level of p-Akt in the pancreatic islet cells of the T2DM + RS/db/db + RS group was partially restored and significantly upregulated compared to the T2DM + DMSO/db/db + DMSO group (n = 5). *p < 0.05 for intra-group comparison, **p < 0.01 for intra-group comparison, #p < 0.05 for inter-group comparison, ##p < 0.01 for inter-group comparison, ns indicates no statistical difference.

