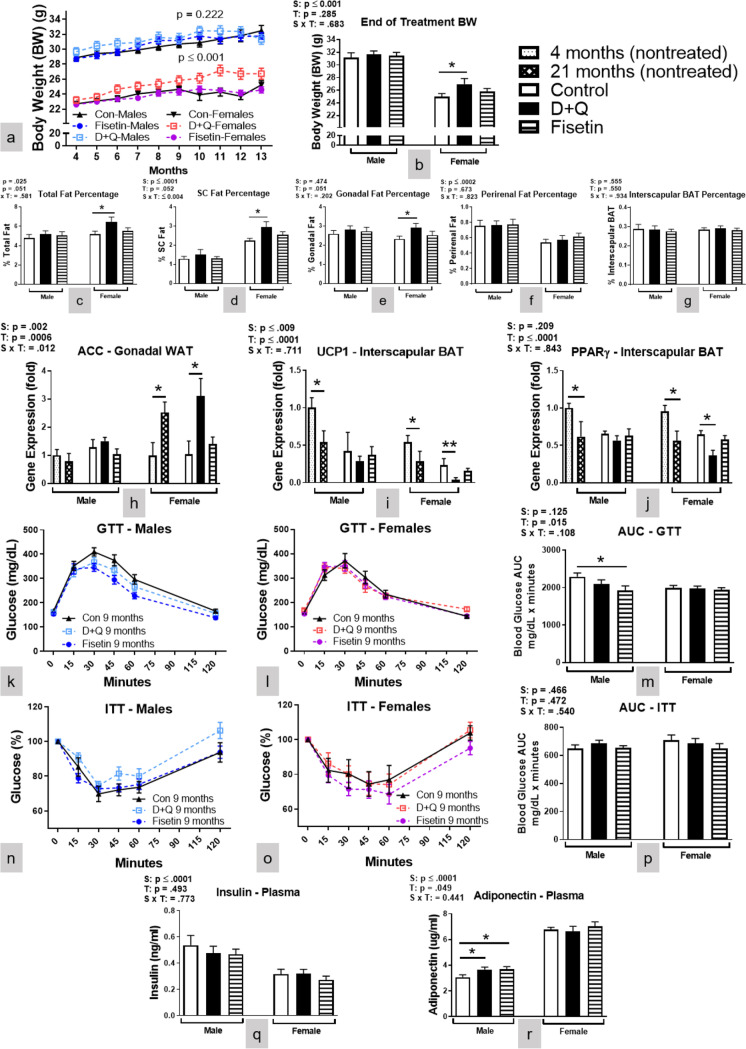
Fig. 2.
D + Q treatment increased abdominal WAT in female mice while Fisetin treatment improved glucose metabolism and increased plasma adiponectin in male mice. Mouse body weight (a-b, BW) along with percentage of total (c) and different adipose tissue depots present in relation to BW (d-g). Gene expression of ACC in gonadal WAT (h) as well as UCP1 and PPARγ in interscapular BAT (i-j) depots. Glucose tolerance test (GTT), insulin tolerance test (ITT), and their respective area under the curve (AUC) after five treatments (k-p). Plasma insulin and adiponectin concentrations (q-r) taken at time of euthanization after 10 treatments. Data are means ± SEM (n = 8–20). A two-way ANOVA was used to determine P-values for the categorial variables (S = Sex and T = Treatment) and their interaction (S x T), which are shown for each bar graph. *p < 0.05, **p < 0.01 based on a two-tailed Student's t test

