
Figure 6.
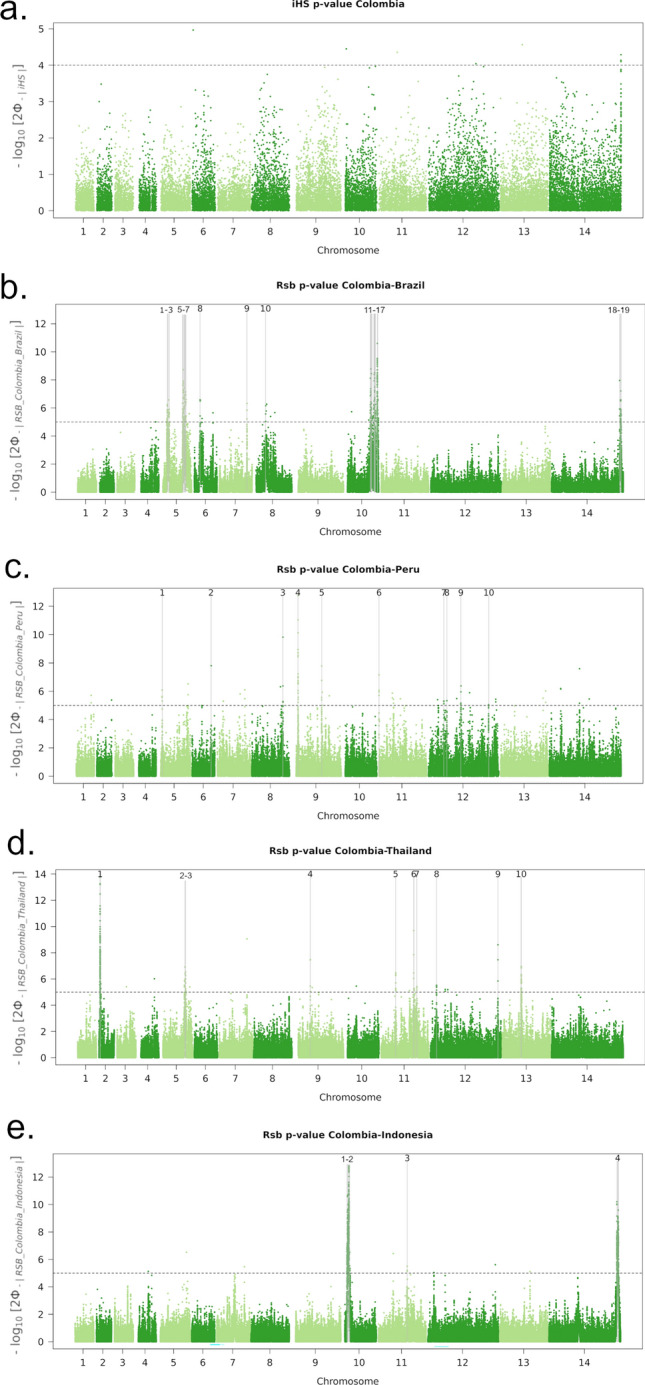
Genome-wide scans of iHS and Rsb-based extended haplotype homozygosity in Colombia. Panel (a) presents a Manhattan plot of the iHS −log10(p) in Colombia. The dashed black line demarks a fixed significance threshold of −log10(p) = 4. There were no signals supported by a minimum of 3 single-nucleotide polymorphisms (SNPs) above the threshold. Panels (b)–(e) present Manhattan plots of the Rsb −log10(p) for the given populations. The dashed black lines demark a fixed significance threshold of −log10(p) = 5: signals supported by a minimum of 3 single-nucleotide polymorphisms (SNPs) above the threshold within 10 kb of one another are demarked with vertical dashed grey lines and numbered. Signals associated with extended haplotypes in Colombia and their putative genetic drivers include: pvmsp1 (PVP01_0728900) in region 9 in the Brazilian comparison (panel b); 1-acyl-sn-glycerol-3-phosphate acyltransferase (PVP01_1262700) in region 10 in the Peruvian comparison (panel c); pyridoxine biosynthesis protein PDX2 (PVP01_0916800) in region 4 in the Thai comparison (panel d); a conserved Plasmodium protein with unknown function (PVP01_1115800) in region 5 (panel d); an oligomeric Golgi complex subunit 4 protein (PVP01_1133300) in region 6 (panel d); 6-cysteine proteins P12 (PVP01_1136400) and P47 (PVP01_1208000) in regions 7 and 8 (panel d); a metacaspase-2 (PVP01_1268600) in region 9 (panel d); and a PIMMS43 protein (PVP01_1129500) in region 3 in the Indonesian comparison (panel e). Further details are provided in Supplementary Table 4.