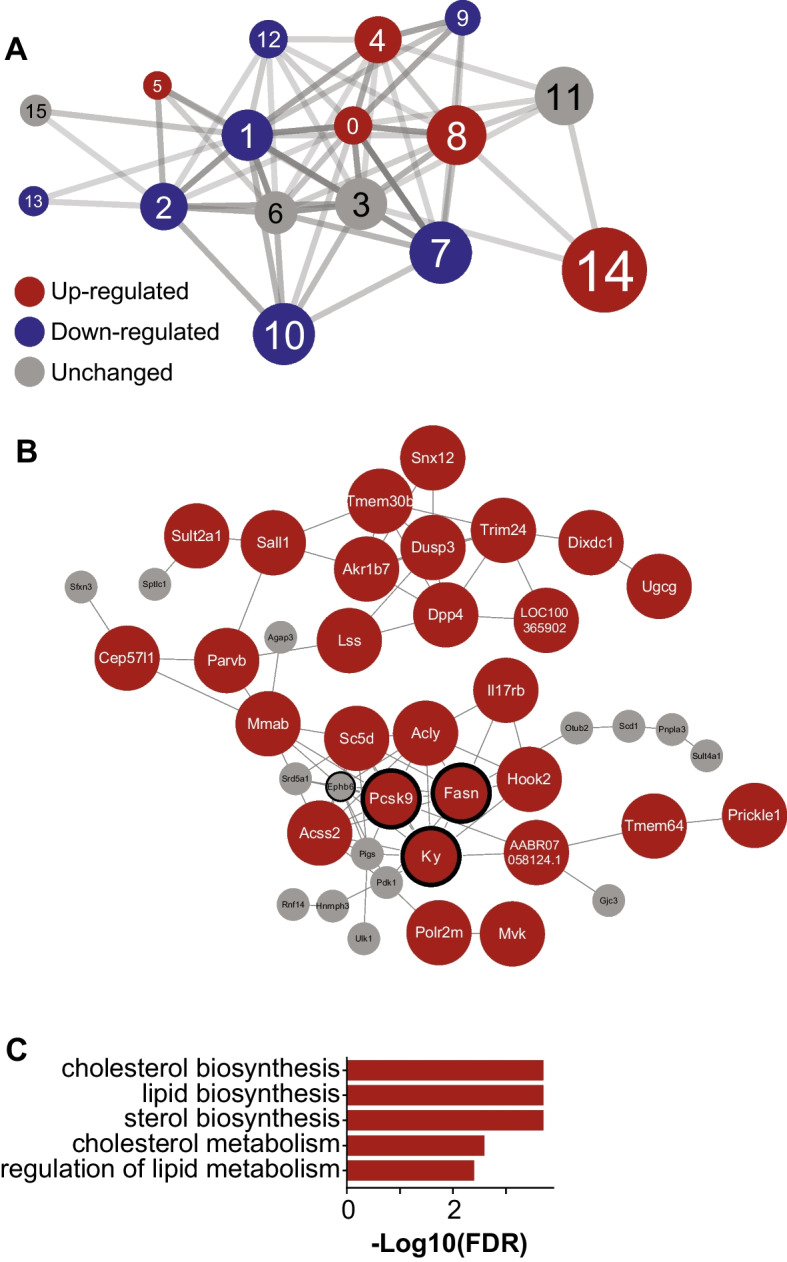
Fig. 8.

Gene co-expression network analysis in the liver. A Sixteen clusters were detected with 10 down-regulated clusters (blue) and 6 up-regulated clusters (red). The size of the clusters denoted their centrality (average clustering coefficient) in the network. B Genes in cluster 14, the most central cluster in the network, with Pcsk9, Ky, Fasn, and Ephb6 as the central genes in the cluster (bold ring) (red: up-regulated, white: unchanged). C Top 5 enriched functions of cluster 14 revealed their role in cholesterol and lipid metabolism
