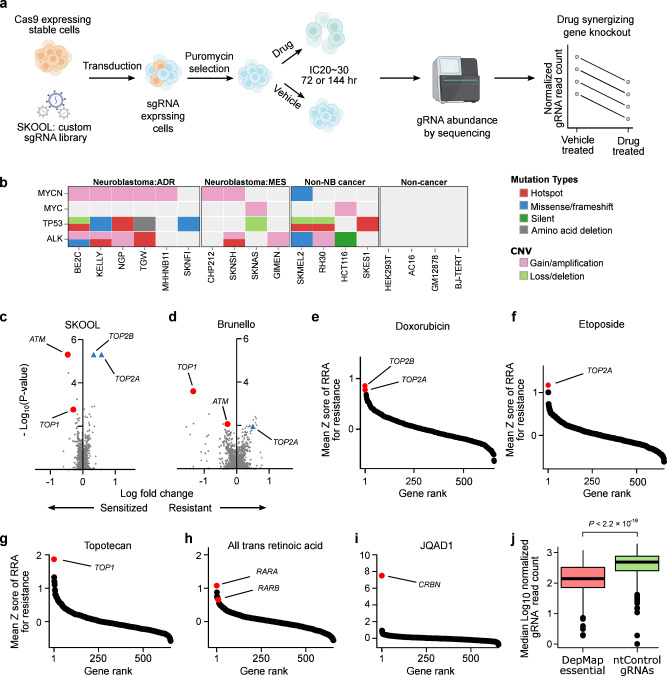
Fig. 1. A CRISPR knockout library, targeted to druggable genes, is a viable strategy to prioritize potential synergies with commonly used chemotherapeutics.
a Simplified schematic of CRISPR-sensitizer screens (detailed schematic available in Supplementary Data Fig. 1a). b Summary of genomics features of cell lines used in the screen. “ADR” refers to predominantly adrenergic neuroblastoma cell lines and “MES” to predominantly mesenchymal cell lines20,22,92. Mutation profiles were obtained from DepMap (details in Supplementary Data Table 2). c Volcano plot showing the log normalized gRNA fold change (LFC; x axis) and P-values (y axis) for each gene knockout in a CX-5461 vs DMSO control treated CHP-134 neuroblastoma cell line. Results were obtained using our 655 gene reduced representation library “SJ KnockOut nOn-Lethal (SKOOL)”. Positive controls, the known sensitizing knockouts (ATM and TOP1) are highlighted as red circles and known resistance knockouts (TOP2A and TOP2B) are highlighted as blue triangles (P-values calculate using MAGeCK). d Like (c) but for results obtained for the same genes using the genome-wide Brunello library. e–i Waterfall plots showing the gene rank for resistance of the direct drug protein targets in our dataset. Genes are ranked by the mean Z scores across all 18 cell lines of their RRA score for resistance. j Boxplot showing the median log10 normalized gRNA read count from all screens in all cell lines (y axis) for n = 400 non-targeting (nt) control gRNAs (green box) and n = 326 gRNAs targeting 55 pan essential genes defined by DepMap (P-value from t-test). In all boxplots, the center line represents the median, the bound of box is upper and lower quartiles and whiskers are 1.5× the interquartile range. Source data are provided as a Source Data file.

