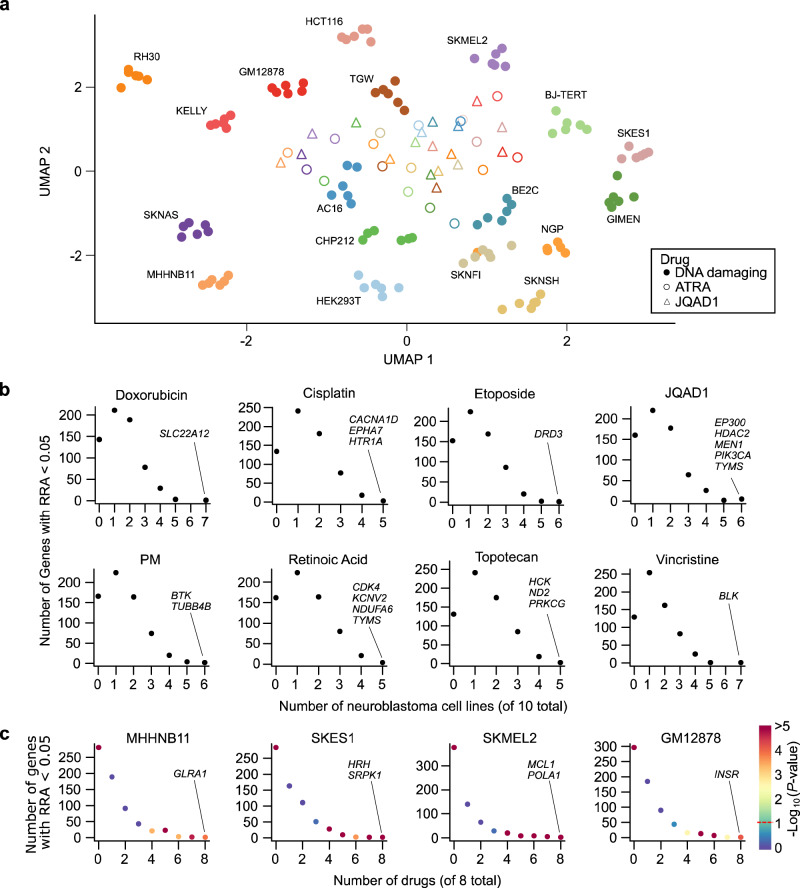
Fig. 2. Systematic examination of the screens identifies cell line-specific effects.
a UMAP representation of all 18 cell lines × 8 drugs = 144 total screens performed. Data are clustered based on fold-change of normalized read counts following each of the 655 gene knockouts profiled. Data points are colored by cell line and the symbol represents whether the cell line was treated with one of the 6 DNA damaging agents (solid circles; cisplatin, doxorubicin, etoposide, phosphoramide mustard, topotecan, or vincristine), all-trans retinoic acid (open circles), or JQAD1 (triangles). b Scatterplot showing the number of neuroblastoma cell lines (x axis) that are sensitized to some gene knockout (at RRA < 0.05; y axis) for each of the 8 drugs screened. Genes sensitizing the maximum number of cell lines to any given drug have been highlighted. c Scatterplot showing the number of drugs (x axis) that are sensitized to some gene knockout (RRA < 0.05; y axis) for each of the 4 different cell lines screened (all 18 cell lines are shown in Supplementary Data Fig. 2f). Genes sensitizing each of these 4 cell lines to all 8 drugs screened are highlighted. P-values were calculated by permutation of all RRA scores. Figure 2a–c. Source data are provided as a Source data file.

