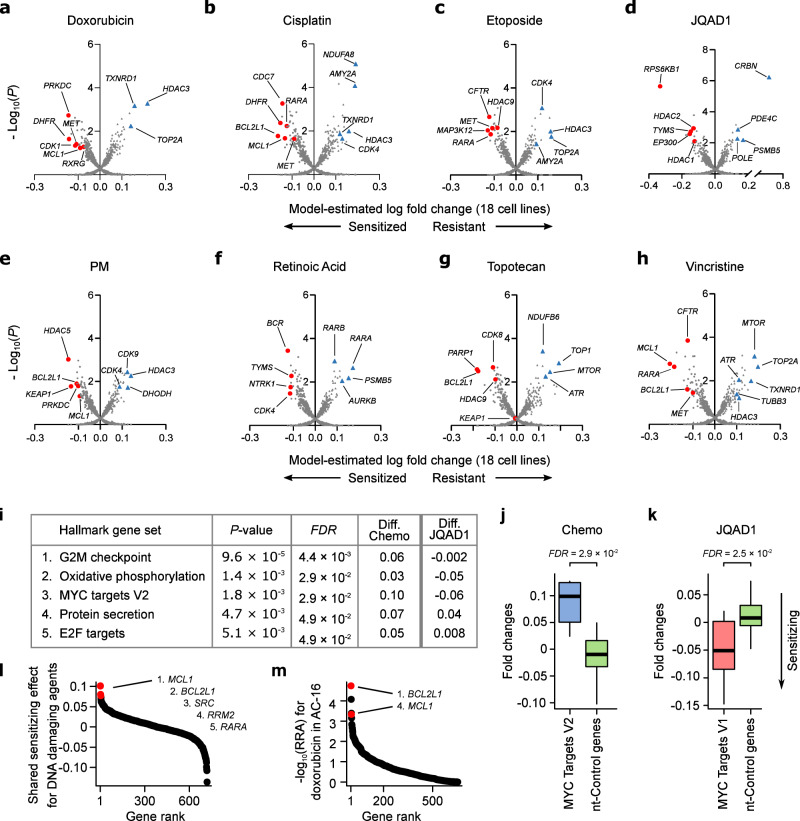
Fig. 3. Summary of drug sensitizing hits identified across the entire dataset.
a–h Volcano plots for each drug showing the estimated mean drug vs mock-treated control normalized gRNA log fold change across all 18 cell lines screened (x axis) and the posterior probability this fold change value is different from 0 (y axis). These values were estimated by fitting our Bayesian Hierarchical model (see Methods) to the 18 fold-change values, and associated measurement uncertainty estimate, obtained for each gene knockout, in each drug. Lower fold change values imply a gene knockout has caused drug-sensitization, with top hits highlighted as red circles. Key resistance knockouts have been highlighted as blue triangles. i Top enriched mSigDB “Hallmark” gene sets from a joint model fit across the 6 DNA damaging agents screened. The values in the columns labeled “Diff.” are the difference in fold change for the median gene in the gene set versus the median of the non-targeting control genes; negative values in these “Diff.” columns imply knockouts of genes from this gene set are associated with drug sensitization. The final column shows the directionality of these hits for JQAD1, which are opposite of the 6 DNA damaging agents for the top 3 gene sets. j Boxplot showing mean estimated drug vs DMSO normalized gRNA log fold changes (y axis) for genes annotated to the mSigDB’s Hallmark MYC targets gene set (blue box, black bar = median (0.11)) vs non-targeting control genes (green box). For each gene, these mean fold change estimates were calculated across all 18 cell lines screened using a joint model that considered the 6 DNA damaging agents screened. (k) Like (j), but for JQAD1 (Hallmark MYC targets gene set (red box, black bar = median (−0.05)). l Waterfall plot ranking gene knockouts (x axis) by their shared sensitizing log fold change effect (y axis) across the 6 DNA damaging agents, estimated using our Bayesian hierarchical model. m Waterfall plot ranking gene knockouts (x axis) by -log10 sensitizing RRA scores (y axis) in the AC-16 outgroup cell line. BCL2L1 and MCL1, which are the top broad sensitizer genes in panel (l), are highlighted in red and sensitize this cardiomyocyte cell line to doxorubicin. In all boxplots, the center line represents the median, the bound of box is upper and lower quartiles and whiskers are 1.5× the interquartile range. Source data are provided as a Source Data file.

