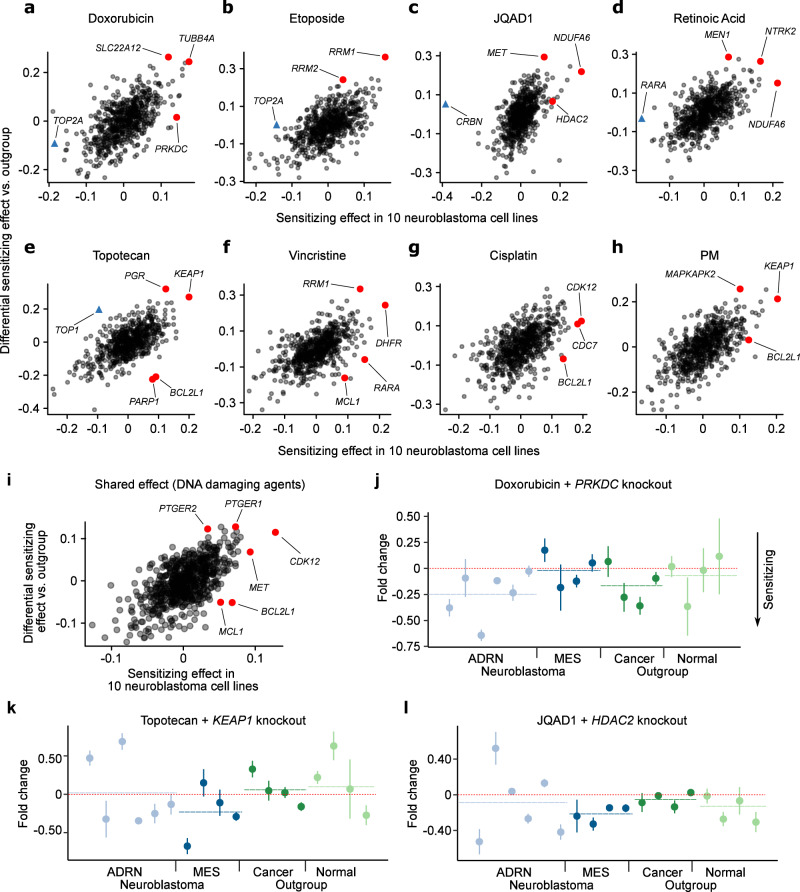
Fig. 4. Summary of differential drug sensitizing hits identified in neuroblastoma cell lines vs the outgroup cell lines.
a–h Scatterplots for each drug showing the estimated mean drug vs mock-treated control normalized gRNA log fold change across in the 10 neuroblastoma cell lines (x axis) and the differential sensitization effect between the 10 neuroblastoma and 8 outgroup cell lines (y axis). Higher values on the x axis imply greater sensitization in neuroblastoma and higher values on the y axis imply greater sensitization in neuroblastoma relative to the outgroup. i Like (a–h) but for the shared effect for the 6 DNA damaging agents, estimated using our Bayesian hierarchical model. j Doxorubicin vs mock-treated control normalized gRNA log fold changes following PRKDC knockout (y axis) for all 18 cell lines screened. Lower values imply sensitization. Neuroblastoma cell lines are colored blue and outgroup cell lines are green. The order of the cell lines (x axis) is the same as Fig. 1b. Whiskers represent the standard error of the mean, estimated from the 6 gRNAs targeting each gene. k Like (j) but for topotecan and KEAP1 knockout. l Like (j) but for JQAD1 and HDAC2 knockout. Source data are provided as a Source Data file.

