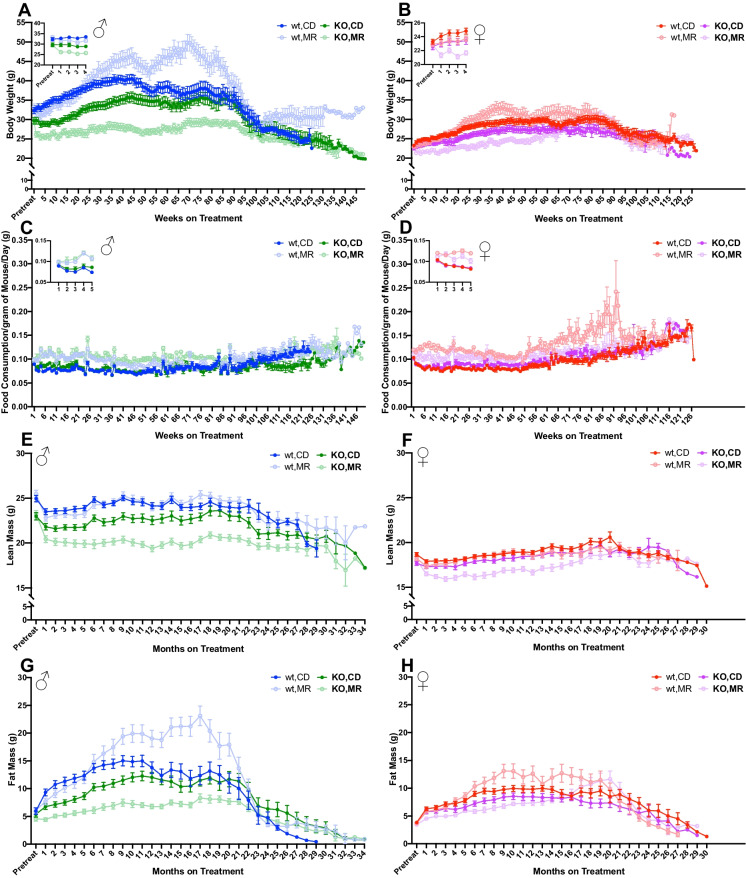
Fig. 1.
MR effects on physiological measures changes with duration of treatment. Body weight (A, B) and normalized food consumption (C, D) were measured weekly. Punch-outs represent an enhanced view of the first 5 timepoints for clarity. Body composition (E–H) was measured every month. Graphs represent mean ± SEM. Group sizes in Table 1

