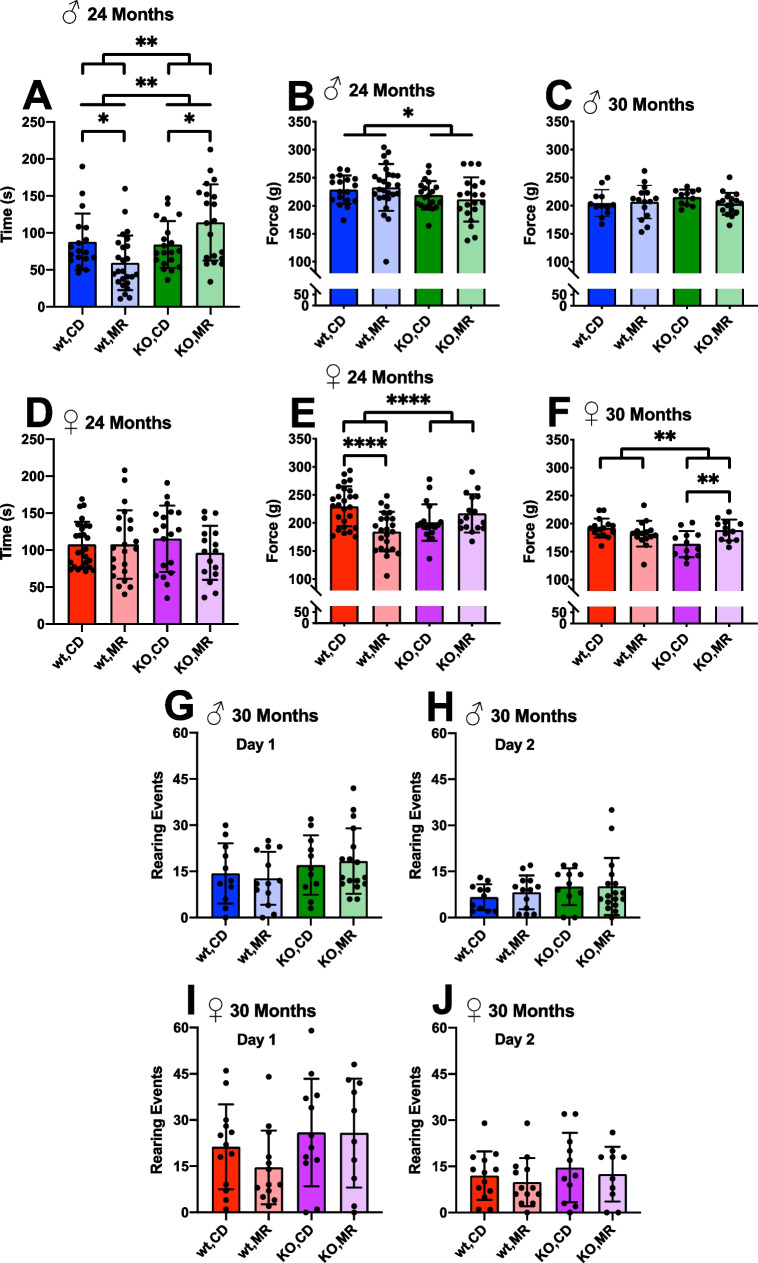
Fig. 4.
MR effects on health span metrics. Physiological assessments of adult mice on long-term MetR. Rotarod was performed at 24 months, and graphs represent day 5 testing results for both sexes (A, D). All limb grip strength force was tested at 24 (B, E) and 30 months (C, F) for both sexes. Rearing assay was performed at 30 months of age on two separate days (G–J). Analysis was within each sex via two-way ANOVA for main effects. Post hoc analysis was performed with Sidac multiple comparisons correction to assess the diet effect within each genotype. Graphs represent means ± SD. Group sizes for each timepoint are in Table 1. (*p < 0.05; **p < 0.01; ***p < 0.001; ****p < 0.0001)

