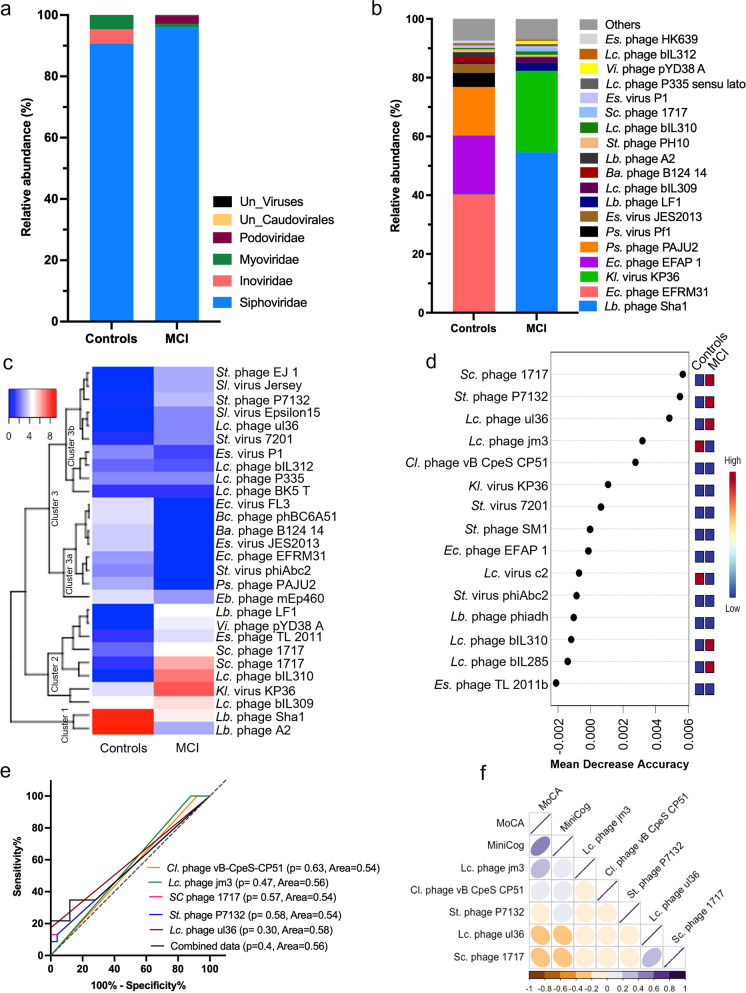
Fig. 2.
The virome signature is significantly distinct in the gut of older adults with MCI compared with controls, with limited potential to predict cognitive health. a,b) The relative abundance of major viral families (a) and species (b) was distinct in the gut microbiome of older adults with MCI compared with controls. c) Heatmap depicting the clusters of increased and decreased abundance of viral species in the gut of older adults with MCI and controls. d) Random forest analysis (RFA) showing the top 15 viral species with the highest discriminatory power between MCI and control groups. Red color indicates high abundance, and blue indicates a low abundance of the particular viral species in MCI and control groups. (e) Receiver operating characteristic (ROC) curve plots represent the specificity and sensitivity of the five selected viral species for the two groups. (f) The Pearson correlation matrix shows the association between the relative abundance of selected 5 viral species with cognitive function measures such as MoCA and MiniCog. Abbreviations—Bacillus; Bc, Bacteroides; Ba, Clostridium; Cl, Enterobacteria; Eb, Enterococcus; Ec, Escherichia; Es, Klebsiella; Kl, Lactobacillus; Lb, Lactococcus; Lc, Pseudomonas; Ps, Salmonella; Sl, Streptococcus; St, Stx2 converting; Sc, Vibrio; Vi

