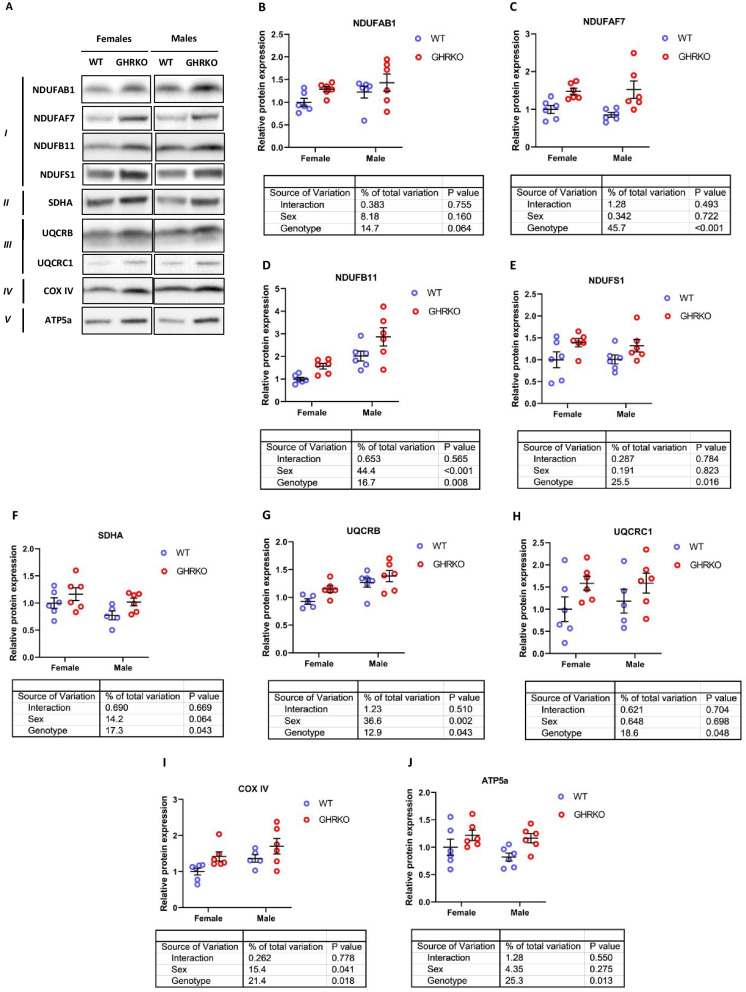
Fig. 3.
Hepatic levels of OXPHOS subunit proteins in WT and GHRKO livers. (A) Representative western blot images for OXPHOS subunits in liver lysates from female and male WT and GHRKO mice. (B-J) Scatter plots of NDUFAB1 (B), NDUFAF7 (C), NDUFB11 (D), NDUFS1 (E), SDHA (F), UQCRB (G), UQCRC1 (H), COX IV (I), and ATP5a (J). Data show mean ± S.E.M. Each symbol represents an individual mouse. n = 5–6 for each group. Two-way ANOVA was used for analysis of genotype effect, sex effect, and their interaction

