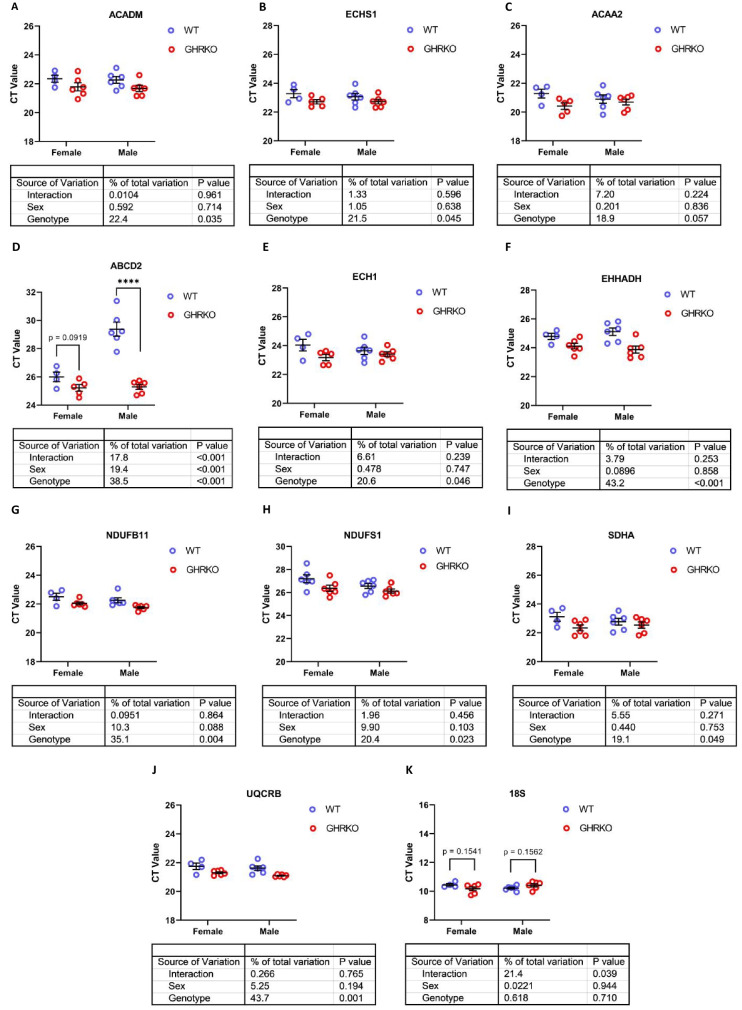
Fig. 4.
Hepatic mRNA levels of FAO and OXPHOS genes in WT and GHRKO livers. (A-K) Scatter plots of ACADM (A), ECHS1 (B), ACAA2 (C), ABCD2 (D), ECH1 (E), EHHADH (F), NDUFB11 (G), NDUFS1 (H), SDHA (I), UQCRB (J), and 18S (K). Data shows mean ± S.E.M. Each symbol represents an individual mouse. n = 4–6 for each group. Two-way ANOVA was used for analysis of genotype effect, sex effect, and their interaction. Unpaired t-test was used when interaction was significant. **** p < 0.0001

