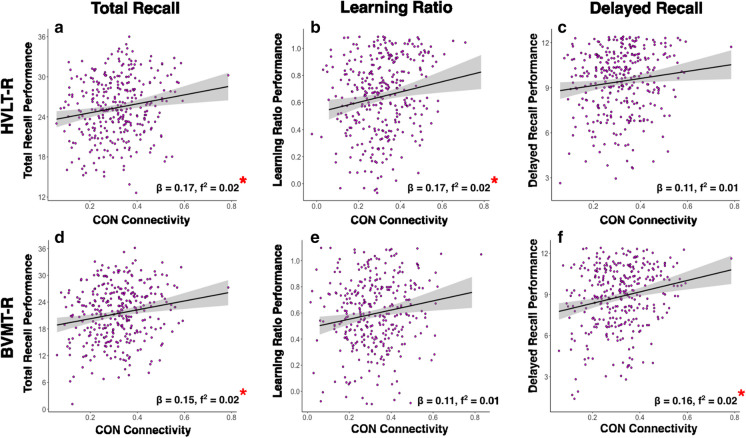
Fig. 1.
These correlation plots are depictions of the relationships found between CON connectivity and learning/memory performance, according to the parent regression models. Plots depict the raw correlations between CON connectivity and a–c HVLT-R performance and d–f BVMT-R performance, without controlling for covariates. For reference, beta and f2-values from the parent models are presented with each plot *pFDR < 0.05

