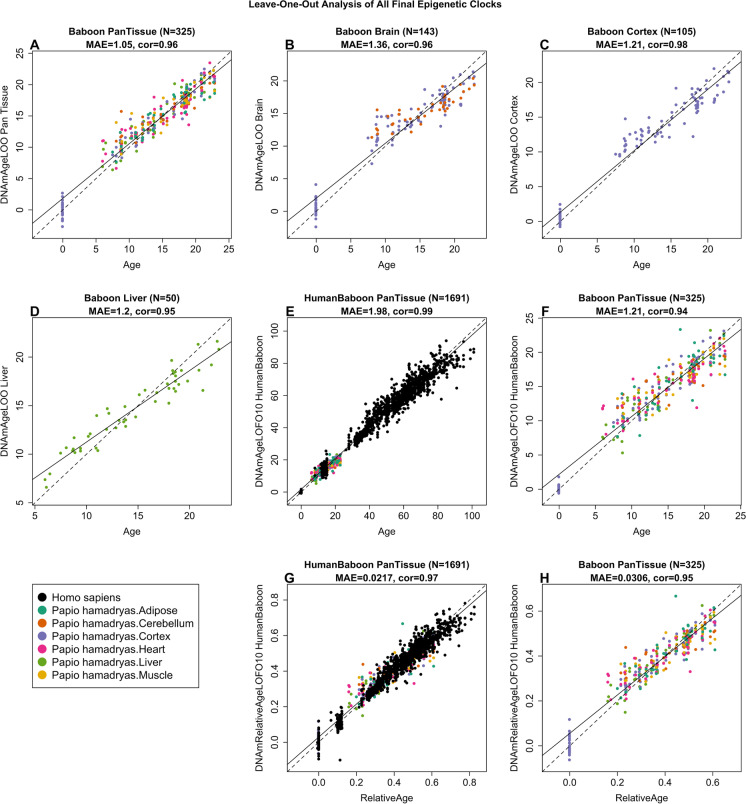
Fig. 1.
Cross-validation study of epigenetic clocks for baboons and humans. A-D) Four epigenetic clocks that were trained on baboon tissues: A) all tissues, B) all brain tissues, C) cerebral cortex, D) liver. E–F) Human-baboon clock for age applied to E) both species and F) baboons only. E) Human samples are colored in (black) and baboon samples (colored by tissue type). G, H) Human-baboon clock for relative age applied to G) both species and H) baboons only. Relative age was defined as the ratio of chronological age to maximum lifespan. Each panel reports the sample size, correlation coefficient, median absolute error (MAE). Dots are colored by tissue type or species. A-D) "LOO" denotes the leave-one-out cross validation estimates of DNA methylation age (y-axis, in units of years). E–H) "LOFO10" denotes the ten-fold cross-validation estimates of age (y-axis, in years)

