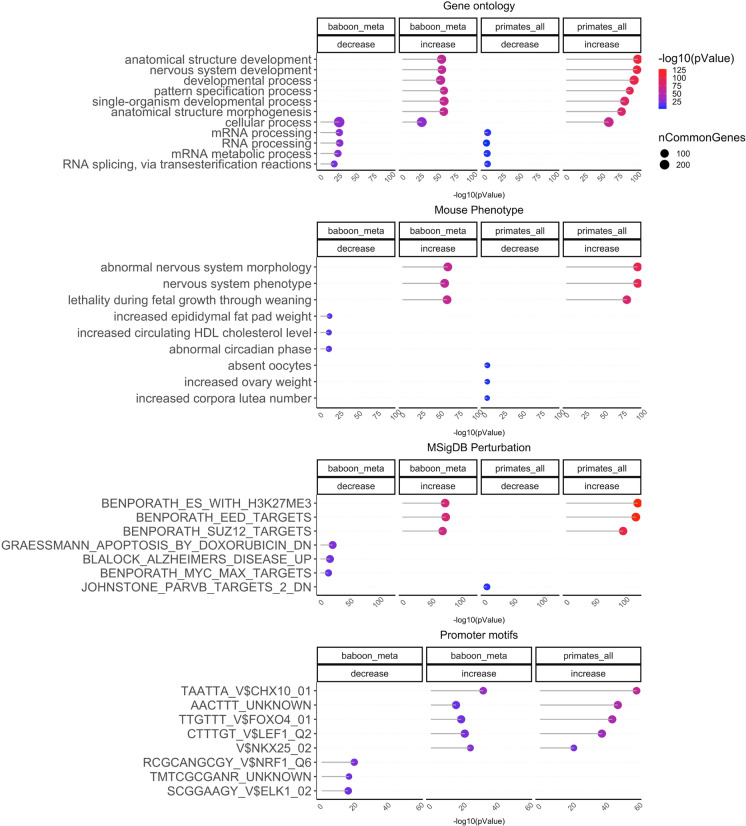
Fig. 4.
Gene set enrichment analysis of aging effects in primates. The genome region based enrichment analysis was carried using GREAT [25] where the statistical background was defined by the probes on the mammalian methylation array in Hg19 assembly. The CpGs are annotated with adjacent genes with gene regulation domain: 5.0 kb upstream, 1.0 kb downstream, plus Distal: up to 50 kb. We extracted up to top 500 CpGs based on p value of association per direction of change as input for the enrichment analysis. The p values are calculated by genomic region based hypergeometric test with the following ontologies: gene ontology, mouse phenotypes, promoter motifs, and MsigDB Perturbation, which includes the expression signatures of genetic perturbations curated in GSEA database. The results were filtered for significance at p < 10–5 and only the top terms for each EWAS are reported

