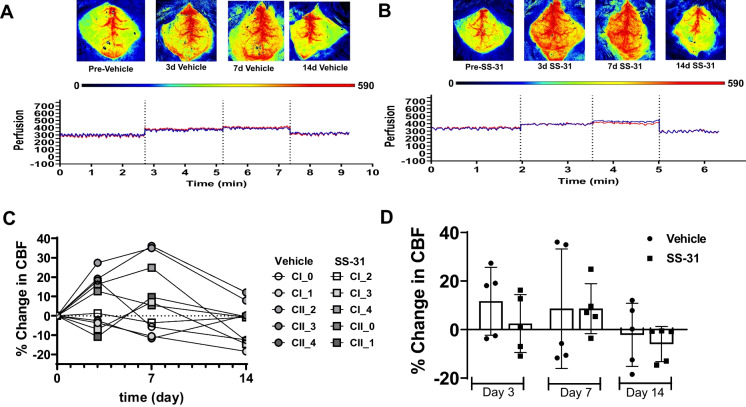
Fig. 1.
SS-31 does not affect baseline CBF. A–B Representative images and CBF recordings from vehicle (saline) and SS-31-treated animals, respectively. The perfusion intensity scale, below the images, indicates the level of brain perfusion. The deep blue color on the perfusion intensity scale denotes “0” or no perfusion, whereas red color corresponds to “590” or well-perfused brain areas. Blue and red lines of CBF recordings are indicative of CBF on the two hemispheres. C Shows the percent changes in CBF of individual animals, whereas panel D represents the summary of CBF changes in the groups, stratified by measurement days. Data expressed as mean ± SD; n = 5 mice in the SS-31 group and n = 5 mice in the vehicle-treated group

