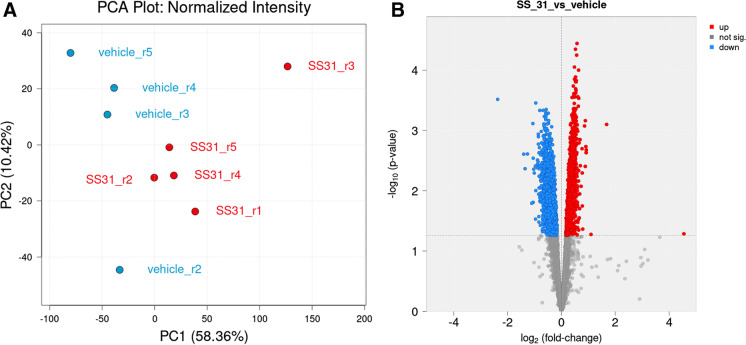
Fig. 3.
SS-31 treatment affects protein abundance of aged MVs. A Principal component analysis (PCA) plot shows protein expression profiles of brain MVs from SS-31 (red color) and vehicle (blue color)-treated aged mice. PC1 and PC2: Principal components 1 and 2, respectively. B Volcano plot shows significantly differentially expressed proteins between the SS-31 and vehicle groups in the global proteome of aged MVs. Red color indicates protein upregulation, blue color corresponds to protein downregulation, whereas gray denotes not significantly differentially expressed proteins in response to SS-31 treatments in isolated brain microvessels

