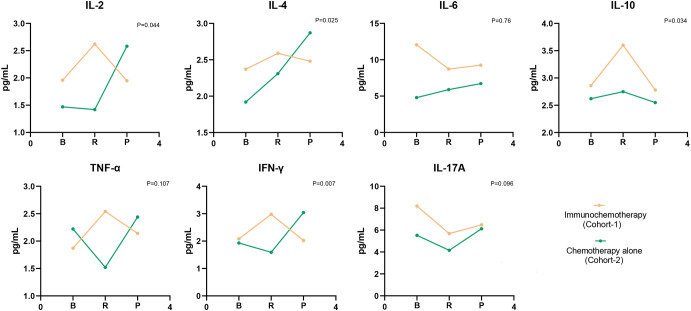
Figure 4.
Evolution of cytokine levels in patients of two Cohorts. Values corresponded to the median of cytokine titers, and p values were obtained taking into account the difference of cytokine levels in the baseline and response period. B, baseline; R, response, include first complete response (CR) and partial response (PR); P, progression.

