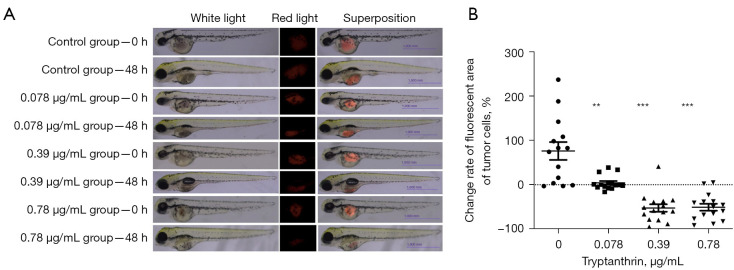
Figure 2.
Inhibition of tumor growth in 48-hpf zebrafish treated with tryptanthrin. (A) Changes in tumor fluorescence in zebrafish; (B) change rate of the tumor fluorescence area in zebrafish. Images in (A) were recorded on a Nikon SMZ800N stereo fluorescence (white light and red light) microscope. The scale bar in (A) represents 1,000 µm; magnification: 4×. **, P<0.01; ***, P<0.001 were considered statistically significant. hpf, hours post-fertilization.

