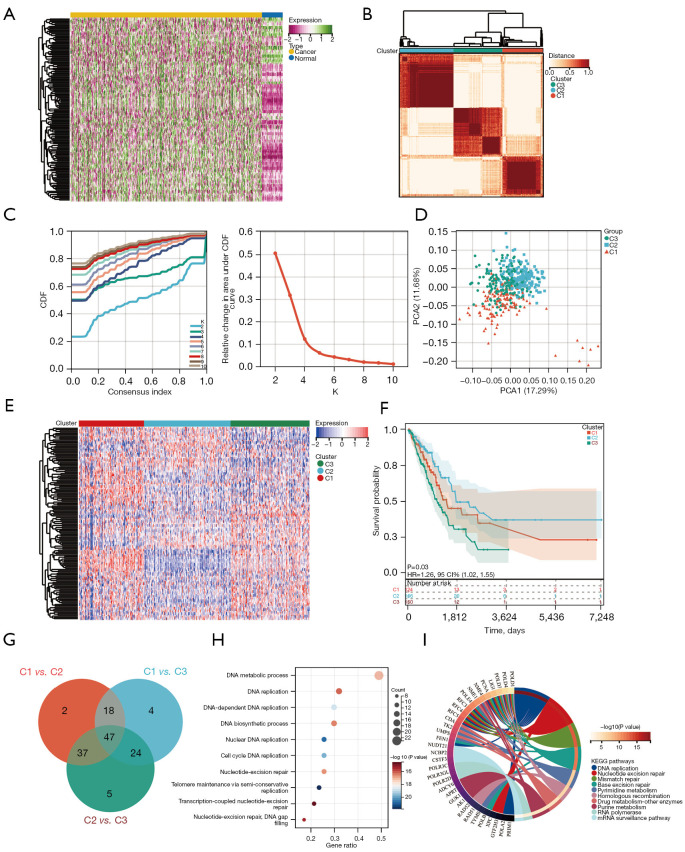
Figure 1.
Identifying DDR-associated subtypes using consensus clustering. (A) Heatmap describing the expression profiles of DRGs in normal and LUAD samples from the TCGA database. (B) Heatmap indicates the consensus clustering solutions for 150 genes in 522 LUAD samples (k=3). (C) Coherent clustering area delta curves depicting the relative changes in the area under the CDF curve for k=2–10. (D) The PCA of the 150-DRG signature. (E) The expression heatmap of 150 DRGs in different subtypes. Red indicates high expression, and blue indicates low expression. (F) Kaplan-Meier OS curves for different subtypes. (G) Venn plot identifying 47 overlapping DEGs among the three groups. (H) Dot plots depict 47 DEGs enriched via GO. The point size represents the number of genes, and the point color represents −log10(Padjust value). (I) Circular plot of KEGG enriched for 47 DEGs. CDF, cumulative distribution function; HR, hazard ratio; CI, confidence interval; DDR, DNA damage repair; DRGs, DNA damage repair-related genes; LUAD, lung adenocarcinoma; TCGA, The Cancer Genome Atlas; PCA, principal component analysis; OS, overall survival; DEG, differentially expressed gene; GO, Gene Ontology.

