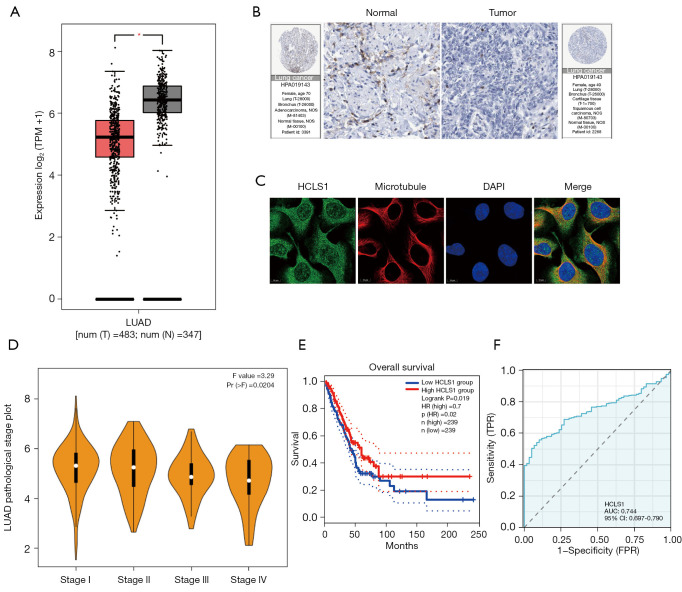
Figure 7.
HCLS1 expression profile and its prognostic value. (A) Differential HCLS1 expression levels in tumor and normal LUAD tissues depend on the TCGA database. (B) The representative IHC images of HCLS1 expression between normal and tumor tissues. Source: https://www.proteinatlas.org/ENSG00000180353-HCLS1/pathology. (C) The distribution of HCLS1 in U2OS cells through immunofluorescence. (D) Violin plots showing differences (log2 TPM + 1) in HCLS1 expression levels among different pathological stages (I, II, III, and IV) using GEPIA. (E) The prognosis of HCLS1 expression for OS in LUAD patients. (F) ROC curves between HCLS1 and tumor prognosis are analyzed following the TCGA and GTEx databases. *, P<0.05. TPM, transcripts per million; LUAD, lung adenocarcinoma; TCGA, The Cancer Genome Atlas; HR, hazard ratio; TPR, true positive rate; AUC, area under the curve; CI, confidence interval; FPR, false positive rate; GEPIA, Gene Expression Profiling Interactive Analysis; OS, overall survival; ROC, receiver operating characteristic; GTEx, Genotype-Tissue Expression.

