Figure 8.
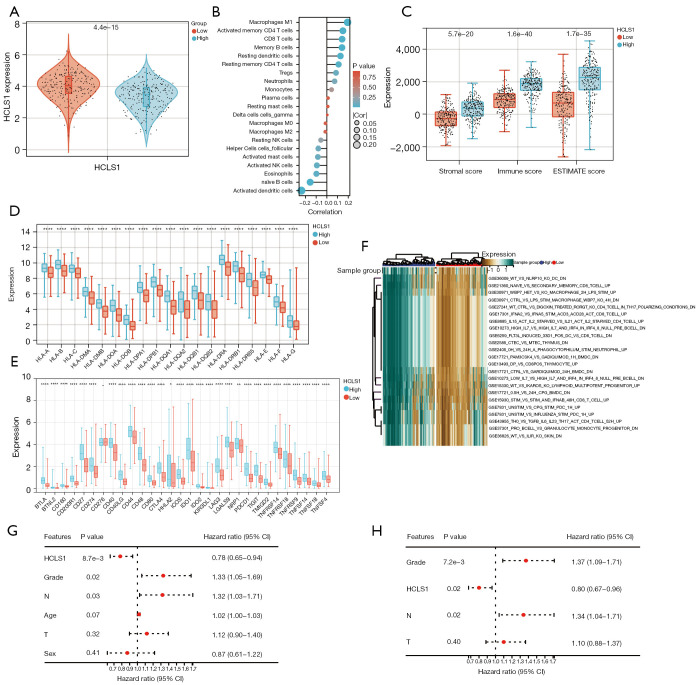
Immune profiling between HCLS1 high and low subtypes. (A) Violin plots depict the expression of HCLS1 in high- and low-risk patients. (B) The correlation between the risk score and relative abundance of 22 immune cell types. (C) Comparison of the stromal, immune, and ESTIMATE scores between HCLS1 high and low subtypes. (D) HLA-related genes and (E) immune checkpoint genes differ between the HCLS1 high- and low-expression groups. (F) Heatmap describes the GSVA analysis results. (G) Univariate and (H) multivariate Cox regression analyses of HCLS1. *, P<0.05; **, P<0.01; ***, P<0.001; ****, P<0.0001; -, no significance. TPM, transcripts per million; DAPI, 4',6-diamidino-2-phenylindole; LUAD, lung adenocarcinoma; HR, hazard ratio; TPR, true positive rate; AUC, area under the curve; CI, confidence interval; FPR, false positive rate; TCGA, The Cancer Genome Atlas; IHC, immunochemistry; GEPIA, Gene Expression Profiling Interactive Analysis; OS, overall survival; ROC, receiver operating characteristic; GTEx, Genotype-Tissue Expression.

