. 2023 Aug 29;29(22):4555–4563. doi: 10.1158/1078-0432.CCR-23-1030

Figure 2.

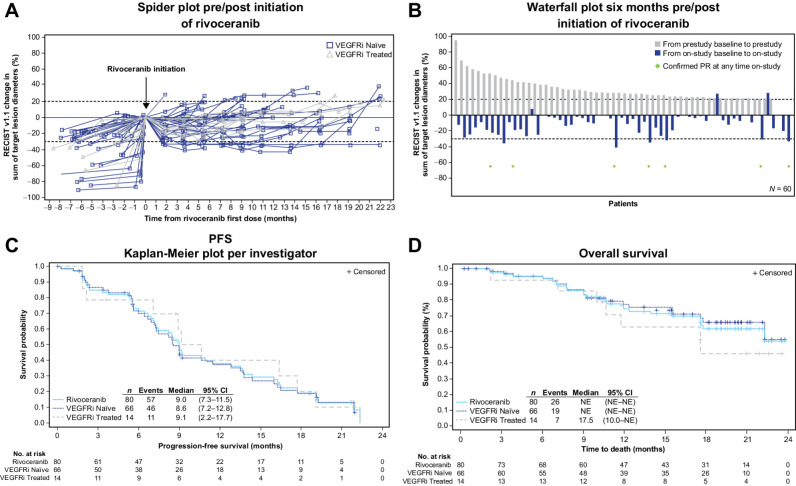
Figure 2. Spider plot and waterfall plot depicting tumor change prior to and following treatment initiation, and Kaplan–Meier estimates of progression-free and overall survival. Population includes patients who demonstrated a ≥20% increase in measurable lesions prior to study (n = 60). A, Change in sum of target lesions per investigator prior to and during rivoceranib treatment. Each line represents one patient. B, Maximum percent change in sum of target lesion diameters per investigator for 6-month period prior to and the first 6 months on study. C, Progression-free survival assessed by investigator in the intention-to-treat population and by prior VEGFRi treatment. D, Overall survival in the intention-to-treat population and by prior VEGFRi treatment.

Spider plot and waterfall plot depicting tumor change prior to and following treatment initiation, and Kaplan–Meier estimates of progression-free and overall survival. Population includes patients who demonstrated a ≥20% increase in measurable lesions prior to study (n = 60). A, Change in sum of target lesions per investigator prior to and during rivoceranib treatment. Each line represents one patient. B, Maximum percent change in sum of target lesion diameters per investigator for 6-month period prior to and the first 6 months on study. C, Progression-free survival assessed by investigator in the intention-to-treat population and by prior VEGFRi treatment. D, Overall survival in the intention-to-treat population and by prior VEGFRi treatment.