. 2023 Sep 13;29(22):4596–4605. doi: 10.1158/1078-0432.CCR-23-1578

Figure 2.

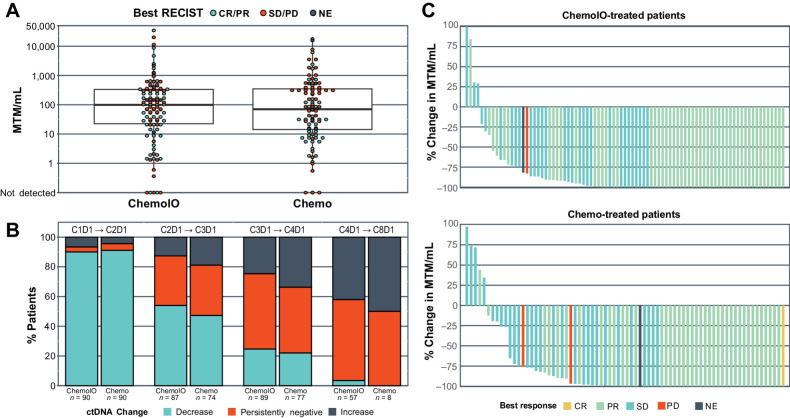
Figure 2. ctDNA is prevalent at baseline and highly dynamic on therapy. A, Baseline ctDNA detected per therapy arm reported as MTM/mL. B, The percentage of patients for each therapy arm with an increase, decrease, or no change in ctDNA between sequential cycles. Included any patients with available plasma at specified timepoints. C, Waterfall plot depicting the percent change in ctDNA between C1D1 and C4D1, measured in MTM/mL. Patients’ best objective response is represented by the color of the bar. Chemo, chemotherapy; ChemoIO, chemotherapy plus immunotherapy; CR, complete response; MTM/mL, mean tumor molecules per mL of plasma; NE, not evaluable; PR, partial response; SD, stable disease; PD, progressive disease.

ctDNA is prevalent at baseline and highly dynamic on therapy. A, Baseline ctDNA detected per therapy arm reported as MTM/mL. B, The percentage of patients for each therapy arm with an increase, decrease, or no change in ctDNA between sequential cycles. Included any patients with available plasma at specified timepoints. C, Waterfall plot depicting the percent change in ctDNA between C1D1 and C4D1, measured in MTM/mL. Patients’ best objective response is represented by the color of the bar. Chemo, chemotherapy; ChemoIO, chemotherapy plus immunotherapy; CR, complete response; MTM/mL, mean tumor molecules per mL of plasma; NE, not evaluable; PR, partial response; SD, stable disease; PD, progressive disease.