Figure 1.
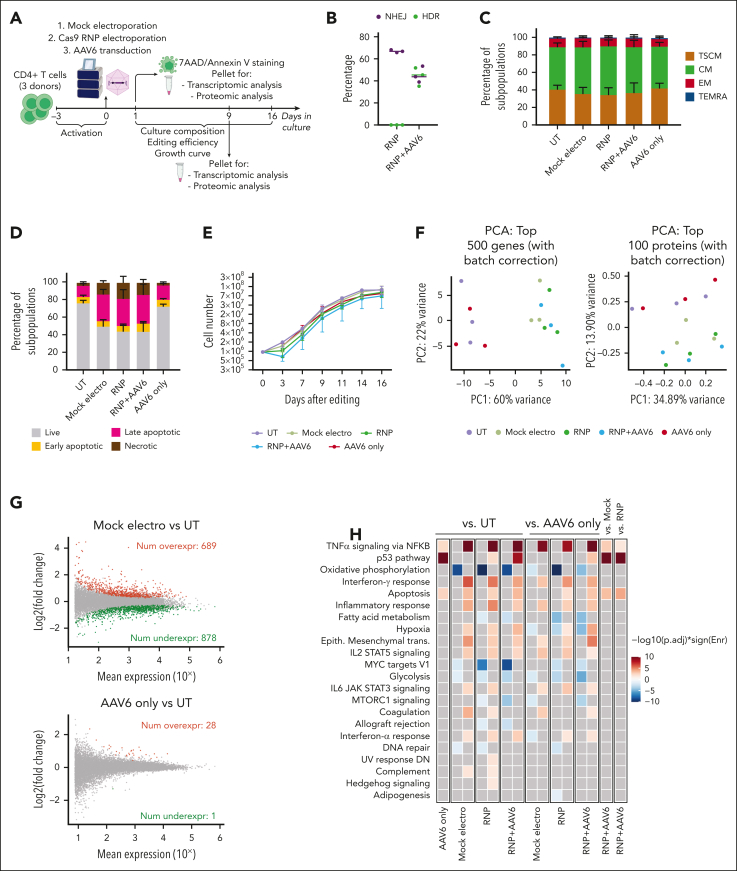
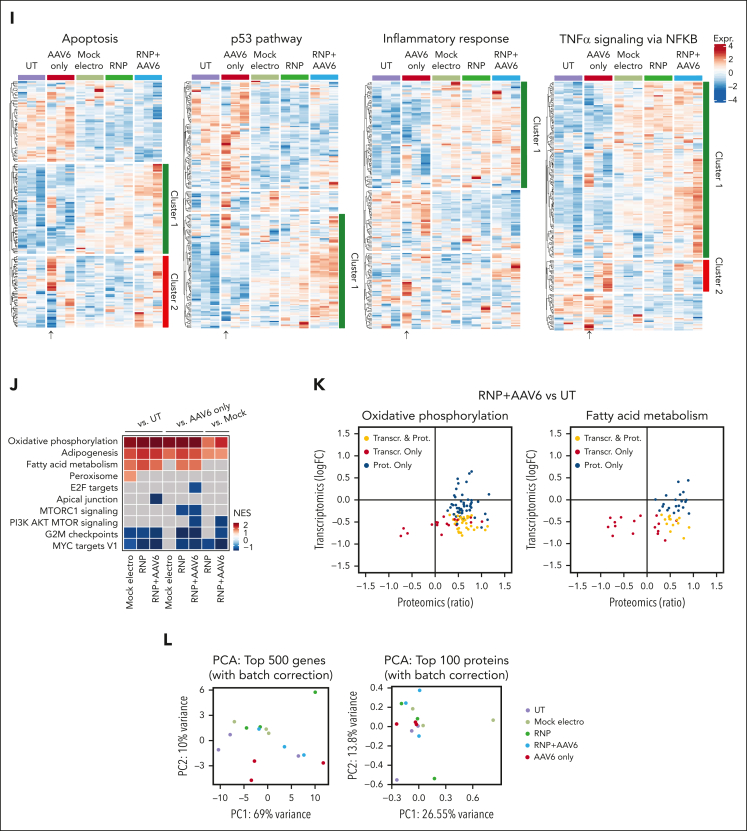
Electroporation induces transient transcriptomic and proteomic changes that promote cell cycle arrest and trigger apoptosis in human CD4+ T cells. (A) Schematic representations of gene editing experimental procedure and multiparametric analysis performed in CD4+ T cells. (B) Percentage of HDR- and NHEJ-edited alleles after CD40LG editing with CRISPR/Cas9 with RNP only or RNP + AAV6 in CD4+ T cells from males (n = 3). Median. (C) Cell population composition of CD4+ T cells in the indicated conditions (n = 3), 16 days after treatment. Data are represented as mean ± standard error of the mean (SEM). CD4+ T-cell phenotypes were defined as follows: effector memory RA (TEMRA): CD45RA+CD62L–; effector memory (EM): CD45RA–CD62L-; central memory (CM): CD45RA–CD62L+; and T memory stem (TSCM): CD45RA+CD62L+. (D) Percentage of live, early/late apoptotic, and necrotic cells 24 hours after editing from panel C (n = 3). Data are represented as mean ± SEM. (E) Growth curve of CD4+ T cells from panel C (n = 3). Data are represented as median ± range. (F) Unsupervised principal component analyses (PCAs) of transcriptomic (left) and proteomic (right) data 12 hours after treatment of CD4+ T cells from panel C. (G) Plot of log intensity ratios vs the mean average signals (MA plot) showing significant DEGs in the mock electro vs UT (top) or AAV6 only vs UT (bottom) comparisons. (H) Heatmap showing enrichment results from all comparisons between conditions from panel C on the hallmark gene set (Molecular Signatures Database). Color intensity reflects statistical significance of the test (adjusted P values), whereas signs (positive or negative) correspond to the set of DEGs used in the statistical test (upregulated or downregulated, respectively). No significant enrichment was found when comparisons are missing. (I) Heatmaps showing normalized read counts for all genes belonging to the indicated categories in conditions from panel C. (J) Heatmap showing NES of proteomic gene set enrichment analysis on differentially expressed proteins (DEPs) pre-ranked based on the ratio of all comparisons between conditions from panel C vs the hallmark gene sets. Missing comparisons indicate that no significant differences were captured in the analysis. (K) Plots showing changes of expression for genes or proteins belonging to the core enrichment of oxidative phosphorylation (left) or fatty acid metabolism (right) categories from the RNP + AAV6 vs UT comparison. (L) Unsupervised PCA of transcriptomic (left) and proteomic (right) data 9 days after treatment of CD4+ T cells from panel C. AAV6 only, AAV6 transduced-only cells, without electroporation.


