Figure 6.
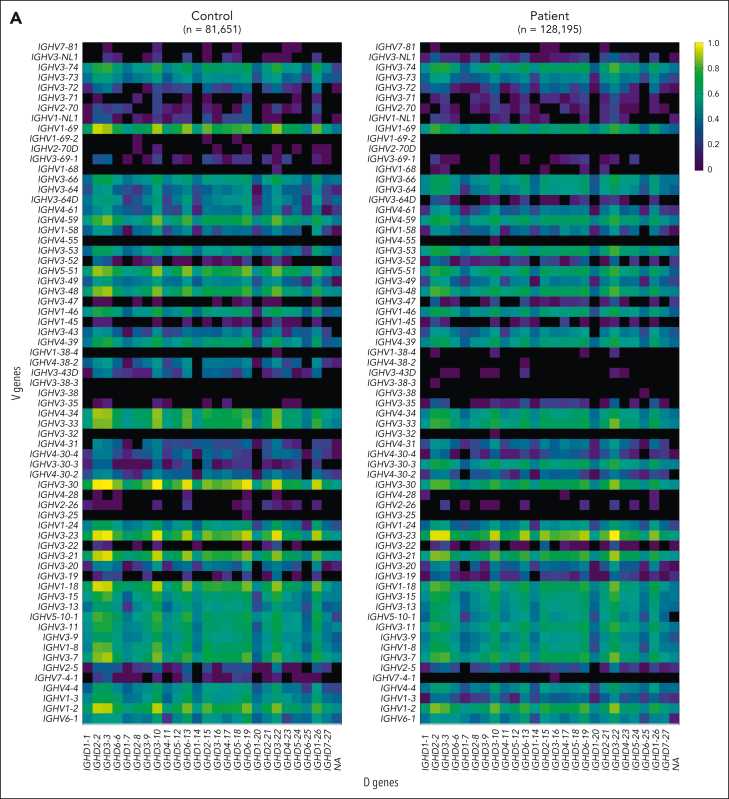
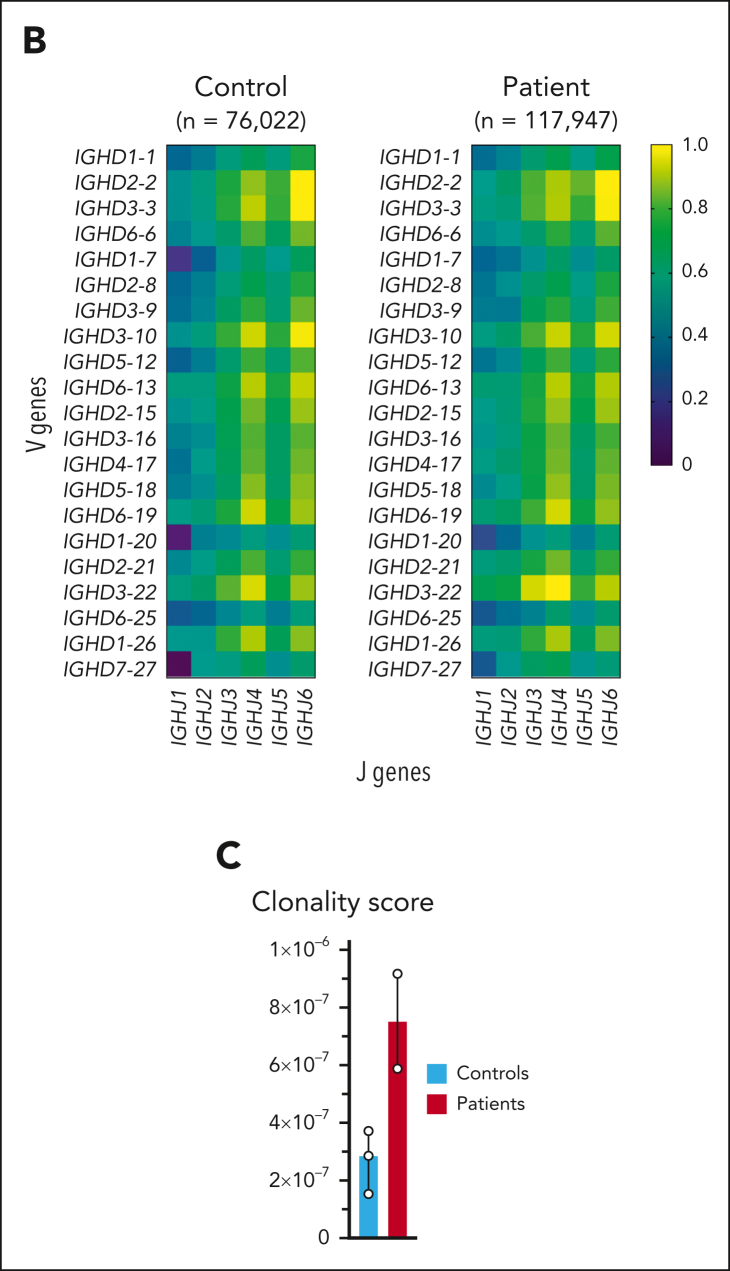
IL-7Rα deficiency increases IGH repertoire clonality. (A-B) Heatmaps showing distribution of V and D genes (A) and D and J genes (B) in IGH repertoire of a representative control and patient. Data show relative values determined by dividing the log of the frequency count of a given gene by the maximum, in order to normalize between 0 and 1. The amount of sequences is indicated above each heatmap. (C) Clonality score of IGH repertoire in healthy, age-matched controls (n = 3) and the patients with IL-7Rα deficiency (n = 2) as defined by Boyd et al.49 Data shown as median with range.


