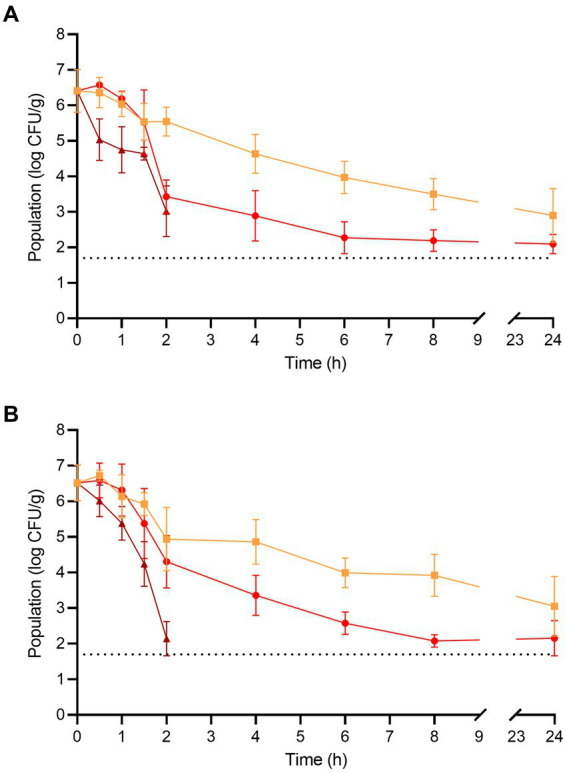
Figure 2.

The populations of (A) L. monocytogenes and (B) S. enterica on enoki mushrooms during dehydration at 70 (orange square), 80 (red circle), and 90°C (brown triangle) for 24 h. The dotted line indicates the lower level of enumeration (1.7 log CFU/g). Data are mean values ± standard deviation (n = 9).
