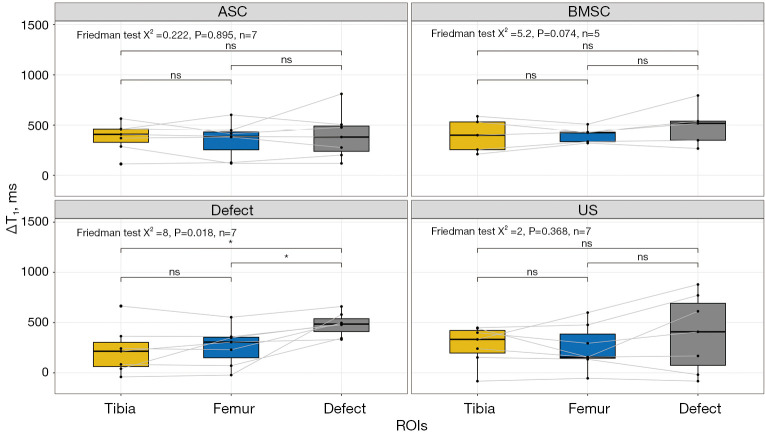
Figure 5.
Visualization of ΔT1 relaxation times (T1 − T1,dGEMRIC) as Boxplot depending on cartilage region and different treatment strategies: collagen scaffold seeded with ASC, seeded with BMSC, defect group, and US. The box indicates the IQR, with the median displayed as a line within the box. The whiskers extend up to 1.5 times the IQR, with any outliers depicted as individual points. *, P<0.05 was considered statistically significant. dGEMRIC, delayed gadolinium-enhanced magnetic resonance imaging of cartilage; ASC, adipose-derived stromal cell; BMSC, bone marrow-derived mesenchymal stromal cell; US, unseeded scaffold; ROI, region of interest; IQR, interquartile range.

