Figure 1.
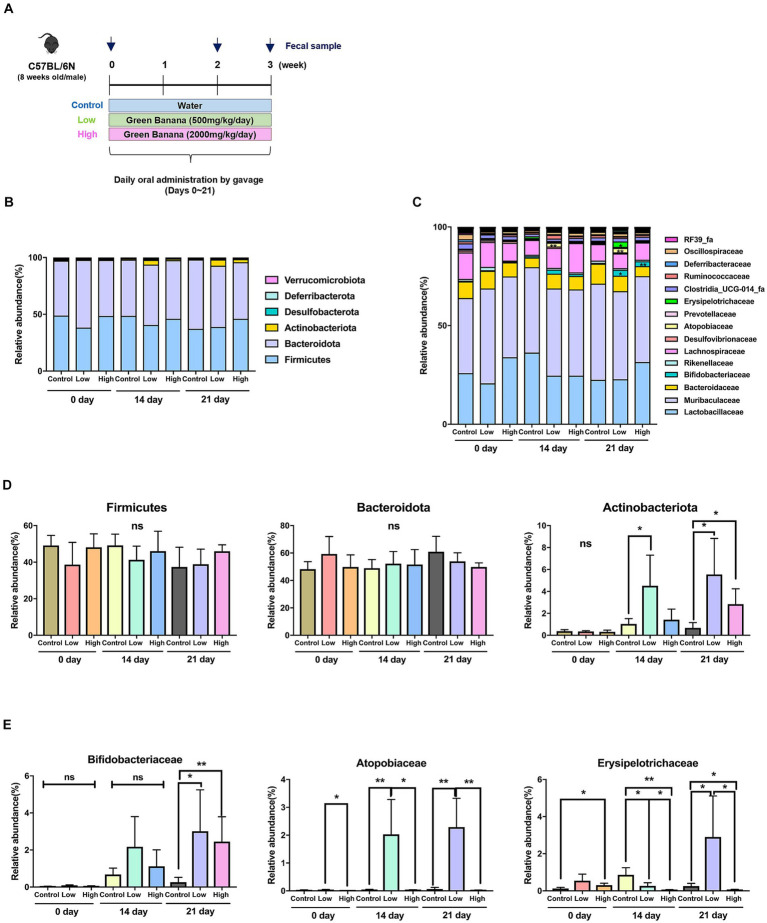
Comparison of intestinal microflora according to green banana flour dosage. (A) Schematics of animal study (C57BL/6N) design. Green banana flour was administered to mice daily by oral gavage during weeks 0–3. On days 0, 14, and 21, the mice fecal sample from all the groups was sampled. (B) Relative abundance of gut microbiota at the phylum level in green banana-gavaged mice. The six most abundant bacterial phyla were obtained from green banana-gavaged mice on days 0, 14, and 21. The phyla with an abundance of 1% or less are not shown. (C) Relative abundance of gut microbiota at the family level in green banana-gavaged mice. The 15 most abundant bacteria families were obtained from green banana-gavaged mice on days 0, 14, and 21. (D) Bar chart showing a relative abundance in a main phylum level. (E) Bar chart showing relative abundance at a specific family level. Unpaired t-tests (two-tailed) were used to analyze variations between the two groups (*p < 0.05 and **p < 0.01, ns means no significant).

