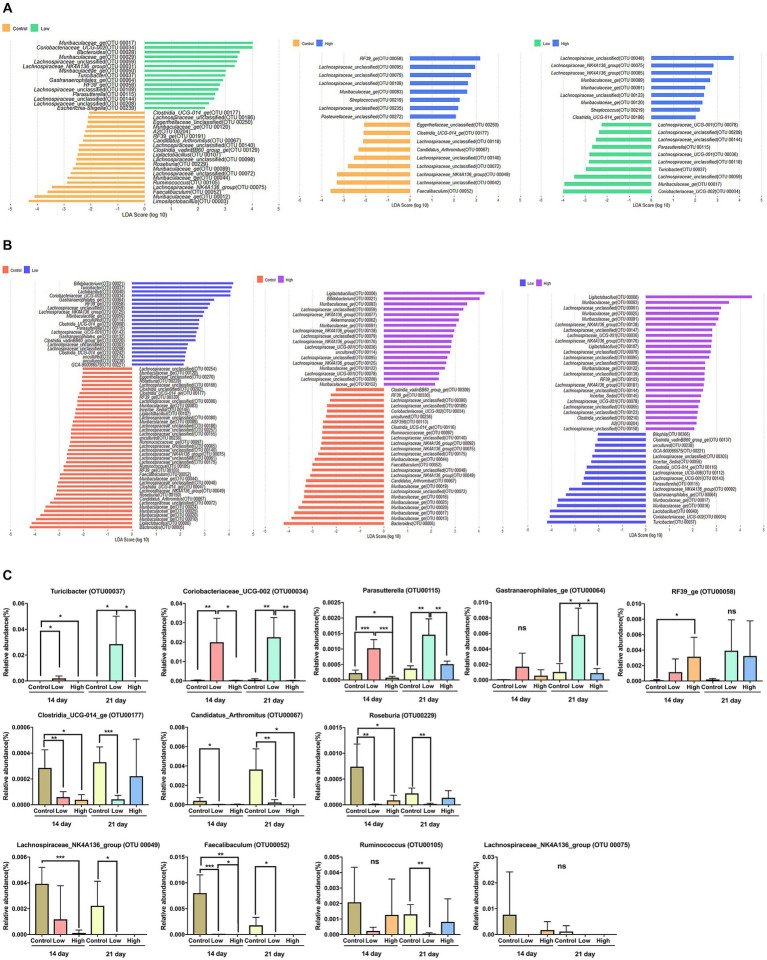
Figure 3.
Differential bacterial taxa between two groups. (A) A linear discriminant analysis effect size (LEfSe) bar plot showing enriched taxa in different groups on day 14. (B) A linear discriminant analysis effect size (LEfSe) bar plot showing enriched taxa in different groups on day 21. The LDA threshold score was 2 or more, and the p-value was 0.05 or less, indicating a difference in bacteria at the genus level. (C) Box plot showing relative abundance for OTUs that were significantly different in LEfSe on days 14 and 21. Unpaired t-tests (two-tailed) were used to analyze variation between the two groups (*p < 0.05, **p < 0.01, and ***p < 0.001, ns means no significant).

