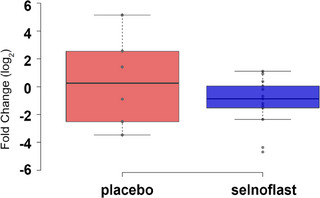
FIGURE 6.

Expression of an IL‐1 gene signature in sigmoid colon tissue. RNA was extracted from sigmoid colon tissue samples that were obtained before treatment and on Day 7 to evaluate the expression of an IL‐1 gene signature by quantitative Polymerase Chain Reaction. The gene signature consisted of a panel of 8 genes: CXCL1, CXCL2, CXCL3, CXCL5, CXCL6, CCL2, IL6 and TNFAIP6. The graph depicts the log2 fold change from baseline to Day 7 using a Box and Whisker Plot. Minimum, lower quartile, median, upper quartile and maximum are shown. The dots represent single samples. There was a slight decrease between baseline and Day 7 in the selnoflast arm, compared to the placebo arm.
