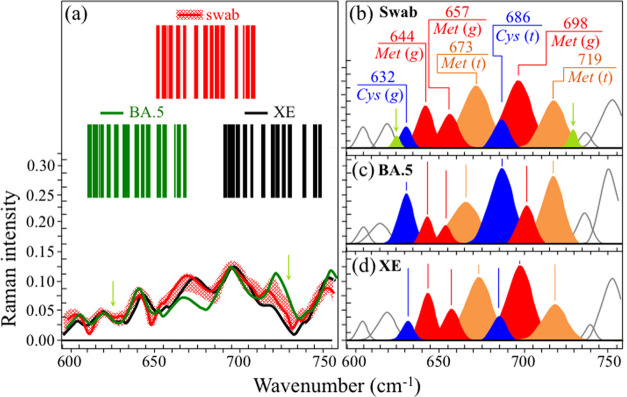
Figure 10.
(a) Average Raman spectra of virions extracted from a human swab sample in the spectral zone between 600 and 750 cm–1, in comparison with average (standard) spectra from BA.5 and XE subvariants (the red-shadowed spectral variation refers to the spectral response of virions extracted from the swab nasal sample); the respective Raman barcodes in the same spectral zone are given in the inset. Panels (b), (c), and (d) show deconvoluted Raman subbands from spectra belonging to human nasal swab, standard BA.5 and XE virions, respectively, as shown in panel (a) (cf. labels in the inset). Matching was similarly found with spectra of BA.5 and XE Omicron subvariants. The wavenumbers in the inset to panel (b) are given in units of cm–1 and the abbreviations are defined in the text. Light-green arrows and subbands locate two minor signals that were detected in virions from the swab sample, but not in standard Omicron samples; their possible origins are discussed in the text.

